Problem
As a data professional, you have probably come across a python script at some point in your career. If, at that point, it did not spark any interest in you, then read this tip for ideas how and where you can benefit from learning python.
Solution
Python is “an interpreted” (as compared to compiled) “high-level general purpose programming language” with an emphasis on “readability”. It is exactly this readability concept that makes python a preferred choice for beginners in programming and has earned it a leading place among data wrangling tools, not to mention an omnipotent status in data science. By contrast, traditional and compiled programming languages are harder to read to a “naked” eye and are more heavily utilized in other areas of computer science.
Python’s allure is also due to these magic properties:
- A rich eco-system: Thousands of packages are available to make life easier for programmers. Some of the most popular ones in the data domain are pandas, numpy, scipy, among a multitude of others.
- Relatively easy to learn: Python does not present a high learning curve such as is the case with Java, C# or other compiled languages due to their more complex syntax rules. This does not mean that you may skip the basic software development principles in your learning path.
- Open-source: Python can be installed on a variety of hosts without complex or costly licensing schemes.
- An involved community: There are dozens of regularly organized conferences and online events some of which help usher new joiners in the exciting world of programming.
- Expressivity: Python is famous for its one-, two-, or three-liner capability, meaning what you would accomplish in C# or Java with a longer sequence of code in python it will usually be way less. Hence the typical “pythonic” way of expressing your code, which aims at making the statements as short as possible while preserving the functionality.
- Flexibility: You do not have to worry about types and data structures much, at least in the beginning. Variables can be assigned values of any type. Python also offers a rich choice of built-in data structures such as lists, tuples, dictionaries, and sets.
With these main points laying the groundwork for what pythons is let us explore some scenarios which can benefit you.
Why would a data professional want to use Python programming?
As a data professional you have a set of tools for your daily job. It will be difficult to list all possible titles a data professional may hold but let us divide them in major categories: data wrangling, data analysis and data visualization. To illustrate this let us assume we have some real estate data in a csv file. We need to wrangle, analyze, and visualize our data. The first five rows look like this:
| Index | Living Space (sq ft) | Beds | Baths | Zip | Year | List Price ($) |
|---|---|---|---|---|---|---|
| 1 | 2222 | 3 | 3.5 | 32312 | 1981 | 250000 |
| 2 | 1628 | 3 | 2 | 32308 | 2009 | 185000 |
| 3 | 3824 | 5 | 4 | 32312 | 1954 | 399000 |
| 4 | 1137 | 3 | 2 | 32309 | 1993 | 150000 |
| 5 | 3560 | 6 | 4 | 32309 | 1973 | 315000 |
Data Wrangling
These days there are lots of tools that allow you to connect to a source system, extract some data and do something with it. Many of these tools are a drag-n-drop interface where you usually place a certain block (or actions) onto a canvas and create a dataflow. Let us take for example Azure Data Factory (ADF). If I wanted to add my dataset, filter (e.g., properties with equal to or more than 3 bedrooms) select a subset of columns (living space, beds, list price), and sort (by price in descending order), then I would create a dataflow that would look something like this:

I will get the following data preview:

With python I can do much the same. I have to add the almighty pandas library and my logic would look like this:

That was a head-to-head comparison of ADF vs a tiny python script. Which one is better depends on the use case. However, if you have a basic python environment already available it is for sure faster to do some data exploration with a script rather than fire the “big guns”. It took me a bit more time to configure a new dataset and to add and configure the relevant dataflow steps in ADF. To make such a script you can refer to many readily available code snippets but also the pandas documentation.
Data Analysis
Next up, what if you wanted to get a taste of how your data is distributed. What would be the quickest way to do that? If you don’t use python, maybe Power BI is the way to go. Quickly load your data into Power BI desktop, then go to Power Query. When you select a column, you will get a convenient column summary, for example for the Beds column:

To do a similar thing with python you need again the pandas library. Once you import your data as csv and convert it to a dataframe, you can call the describe() method:

As you can see, we are getting an identical description data for the Beds column. But where is the histogram? Just call the hist() method to get a histogram for all numeric columns:

With this example I hope to show how much quicker and thorough you can do things in this case.
Data Visualization
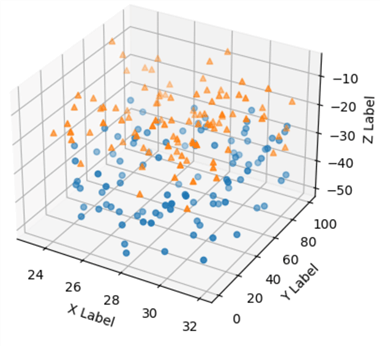
And in case you wanted to visualize something? Maybe it is a quick summary before a presentation or maybe you are doing exploratory visualizations? There are thousands of ways to do this with python. Arguably though, using python for this may be a bit more advanced or the overkill in this case. With Power BI or Excel, you could get a couple of basic charts going in no time. Still, with python and matplotlib (one of the most popular charting libraries) you can provide way more complex and detailed charts. For example, a 3D-scatter plot, which is not available out-of-the-box in Power BI:
Why would a data professional NOT want to use Python programming?
It is fair to also examine the other side of the coin too. One such point would be that while it is very fast and straightforward to import a couple of packages and write a two-liner for some data wrangling, the execution speed of your script may be suboptimal by design. The reason for that is inherent to all scripted languages. Generally, compiled languages have faster execution times. Python is also known to be a subpar performer when it comes to multi-threaded applications. This is hardly an issue for the data professional though and more of a consideration for a traditional software engineer. Finally, there are other specialized computing languages and eco-systems, for instance SAS and R. While R, like python, also integrates with SQL Server, it is considered more of a language for the domain expert rather than the tech professional (meaning chances are higher to encounter an engineer or a professor of medicine who works with R than with python).
Conclusion
Finally, why would you use python if you already have the tool of your choice? Check the following table matching usual activities of a data professional (Activity) and some hand-picked tools (Tool) that you can execute them with.
| Activity | Tool |
|---|---|
| Extraction | SQL, SSIS, ADF, Python |
| Transformation | SSIS, ADF, Python |
| Load | SSIS, ADF, Python |
| Visualization | Power BI, Python |
| Data science | ADF, Python |
It seems with python one could do all the target activities. You are more flexible as you have only one environment to work with, especially in the case of Databricks which supports a python flavor called pyspark. Databricks could also further boost what you can do with python and combine all these activities into one consolidated place. If you work with ADF, then you could execute python in a pipeline too. On the other hand, undoubtedly Power BI is the leading tool for visualizations. While it does lack certain visuals, they could be implemented with python as the python run-time is supported by Power BI. These facts all show that a good synergy exists between the leading tools of the trade and python.
Next Steps
- Get started with python
- Get started with pandas
- Visualize data with python
- Create a Python Django Website with a SQL Server Database
- Python Programming Tutorial with Top-Down Approach

Hristo Hristov is a seasoned data professional with 10+ years of experience spanning the intersection of data engineering and smart manufacturing solutions. Since 2017, he has specialized in implementing advanced analytics solutions for bridging the IT/OT gap.
A technical writer with over 80 published articles on data and AI technologies, Python development, and cloud solutions. Passionate about transforming complex data into business value through innovative applications of Azure Data Platform, Python, IoT solutions, databases, and other cloud technologies.
Currently applying Industry 4.0 best practices, focusing on IoT connectivity, and implementing data and AI systems in manufacturing. Hristo holds a degree in Data Science and several Microsoft certifications covering SQL Server, Power BI, and related technologies.
- MSSQLTips Awards
- Achiever Award (75+ tips) – 2026
- Rookie of the Year – 2021
- Author Contender – 2022/2023/2024/2025


I have learned from you, I am very impressed
Thanks for the comment. In case I have failed to clarify this in the article, python MAY be better, may be not. Depends on the scenario, also skillset of the person doing it. In any case, the point here is to make a high-level comparison in a concise form.
Well done for the python but have you just compared an ETL (Tool) with Python (a programming language) and claimed that Python is better than just because of that?
Python equivalent is C# and indeed it is not so hard to write Linq for data queries.
Python is strong just because it is easy to learn, read, and code and has a better visualization options.