By: Ron L'Esteve | Updated: 2022-04-06 | Comments | Related: > Azure Databricks
Problem
Building performant, scalable, maintainable, reliable, and testable live data Lakehouse ELT pipelines in Azure is a critical need for many customers. These pipelines should support custom defined ELT scripts, task orchestration, monitoring, and more. Within Azure, Data Factory and Databricks there is support for many of these ELT capabilities and they possess robust feature sets. Databricks Delta Live Tables enables Data Engineers to define live data pipelines using a series of Apache Spark tasks. Additionally, with Delta Live Tables, developers can schedule and monitor jobs, manage clusters, handle errors, and enforce data quality standards on live data with ease. Customers are interested in getting started with Delta Live Tables.
Solution
Delta Live Tables supports the building and delivering of high quality and well-defined live ELT pipelines on Delta Lake. With automatic testing, validation, and integrity checks along the way, Delta Live Tables to ensure live data pipelines are accurate and of the highest quality. Delta Live Tables provide visibility into operational pipelines with built in governance, versioning, and documentation features to visually track statistics and data lineage. Additionally, Delta Live Tables supports the ingestion of streaming data via Auto Loader.
In this article, you will learn how to get started with Delta Live tables for building pipeline definitions within your Databricks notebooks to ingest data into the Lakehouse and to declaratively build live pipelines to transform raw data, and aggregate business level data for insights and analytics. You will also learn how to get started with implementing declarative data quality expectations and checks in your pipeline, add comments for documentation within the pipelines, curate the raw data and prepare it for further analysis all using either SQL or PySpark syntax. You will also learn how to create, configure, and run Delta Live Table pipelines and jobs.
Create a Notebook
The first step of creating a Delta Live Table (DLT) pipeline is to create a new Databricks notebook which is attached to a cluster. Delta Live Tables support both Python and SQL notebook languages.
The code below presents a sample DLT notebook containing three sections of scripts for the three stages in the ELT process for this pipeline. The first section will create a live table on your raw data. The format of the source data can be delta, parquet, csv, json and more. The source data can be linked to streaming data flowing into your Delta Lake from cloud_files and Auto loader sources. Once the first level of the DLT script runs, it will run the next dependent level of the pipeline which creates a live table for your staged data. In this scenario, the script defines expectations that the VendorID is not null and that the passenger_count is greater than 0 using the EXPECT command. If a violation occurs that does not meet these criteria, those rows will fail to be inserted into this table as a result of the ON VIOLATION command. FAIL UPDATE will immediately stop pipeline execution, whereas DROP ROW will drop the record and continue processing. The EXPECT function can be used at any stage of the pipeline. The select statements in this staging section can be further customized to include joins, aggregations, data cleansing and more. The final level of the DLT script will curate and prepare the final Fact table and will be dependent on the previous staging table script. This wholistic script defines the end-to-end ELT multi staged flow from taking raw data to updating a final consumption layer fact table.
CREATE LIVE TABLE nyctaxi_raw
COMMENT "This is the raw nyctaxi dataset in Delta Format."
SELECT * FROM delta. `/mnt/raw/delta/Factnyctaxi`

CREATE LIVE TABLE Factnyctaxi_staging(
  CONSTRAINT valid_VendorID EXPECT (VendorID IS NOT NULL),
  CONSTRAINT valid_passenger_count EXPECT (passenger_count > 0) ON VIOLATION DROP ROW
)
COMMENT "nyctaxi data cleaned and prepared for analysis."
AS SELECT
  VendorID AS ID,
  CAST(passenger_count AS INT) AS Count,
  total_amount AS Amount,
  trip_distance AS Distance,
  tpep_pickup_datetime AS PickUp_Datetime,
  tpep_dropoff_datetime AS DropOff_Datetime
FROM live.nyctaxi_raw


CREATE LIVE TABLE Factnyctaxi
COMMENT "The curated Factnyc table containing aggregated counts, amounts, and distance data."
AS SELECT
  VendorID AS ID,
  tpep_pickup_datetime AS PickUp_Datetime,
  tpep_dropoff_datetime AS DropOff_Datetime,
  CAST(passenger_count AS INT) AS Count,
  total_amount AS Amount,
  trip_distance AS Distance
FROM live.Factnyctaxi_staging
WHERE tpep_pickup_datetime BETWEEN '2019-03-01 00:00:00' AND  '2020-03-01 00:00:00'
AND passenger_count IS NOT NULL
GROUP BY VendorID, tpep_pickup_datetime, tpep_dropoff_datetime, CAST(passenger_count AS INT), total_amount, trip_distance
ORDER BY VendorID ASC
This SQL code could just as easily be written in Python if needed. You'll first need to run commands similar to the following script shown below to import delta live tables along with PySpark SQL functions and types.
import dlt
from pyspark.sql.functions import *
from pyspark.sql.types import *
Similar to the SQL EXPECT function in the SQL DLT pipeline notebook script above, within PySpark, the following commands can be used to handle row violations based on the expectations:
- expect: If a row violates the expectation, include the row in the target dataset.
- expect_or_drop: If a row violates the expectation, drop the row from the target dataset.
- expect_or_fail: If a row violates the expectation, immediately stop execution.
- expect_all: If a row violates any of the expectations, include the row in the target dataset.
- expect_all_or_drop: If a row violates any of the expectations, drop the row from the target dataset.
- expect_all_or_fail: If a row violates any of the expectations, immediately stop execution.
Create and Run a Pipeline
A pipeline within Delta Live Tables is a directed acyclic graph (DAG) linking data sources to target datasets. In the previous section you learned how to create the contents of DLT datasets using SQL queries. Once the scripts have been created, you can create a pipeline, as shown in the figure below. When creating a pipeline, you'll need to fill in the required configuration properties using either the UI or JSON code. At a basic level, you'll need to specify the pipeline name, location where the DLT notebook code is stored, the storage location, pipeline mode, and cluster specs. If your scripts are spread across multiple notebooks, these various notebooks can also be added as notebook libraries and the pipeline will workout the lineage as long as the notebooks reference the right stages and processes. Additionally, configurations can be added to specify parameters and / or other key value type pairs that can be referenced in the pipeline.
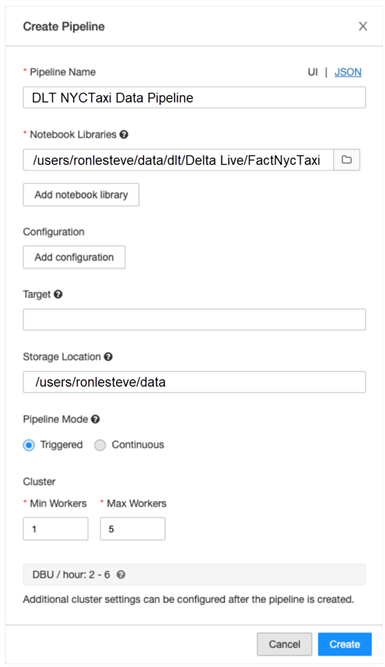
As an example, here is what the pipeline's JSON script would look like. This JSON can be further customized as needed.
{
  "name": "DLT NYCTaxi Data Pipeline",
  "storage": "/mnt/data/raw/Factnyctaxi",
  "clusters": [
    {
      "num_workers": 1,
      "spark_conf": {}
    }
  ],
  "libraries": [
    {
      "notebook": {
         "path": "/Users/ronlesteve/dlt/Factnyctaxi
      }
    }
  ],
  "continuous": false
}
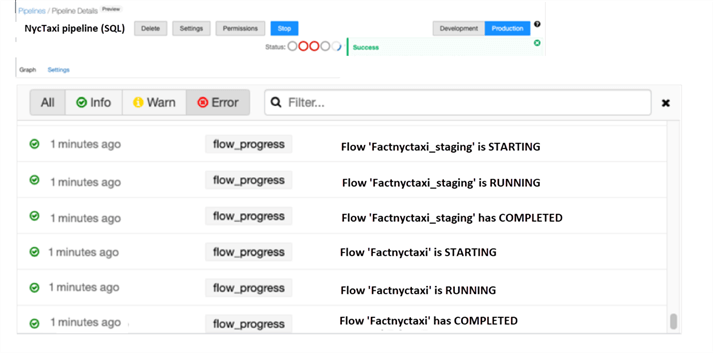
After creating the pipeline, it can be further configured, started, and monitored in both your development and production environments. Notice from the Pipeline Details UI shown in the figure below that the info displays the start, run, and completing status of the pipeline steps.
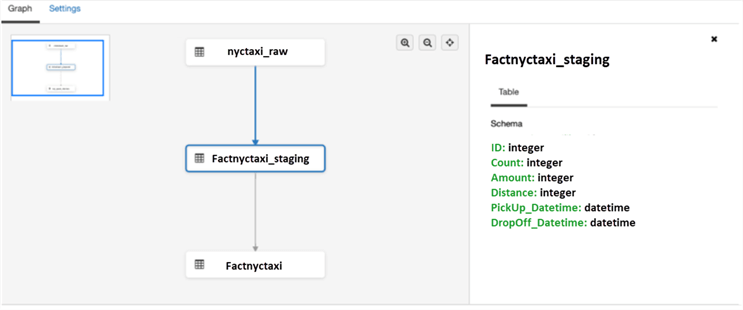
Notice from the figure below that the graph tracks the dependencies between jobs to clearly display the lineage. By clicking on the table, you'll be able to view the defined schema of the table. While this lineage is quite simple, complex lineage showing multiple table-joins and interdependencies can also be clearly displayed and tracked on this graph.
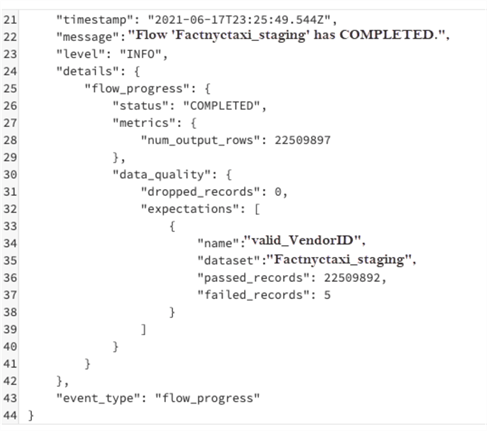
Once the pipeline completes running, it will display meta data related metrics that have been tracked for the job, as shown in the figure below. Notice that it shows the number of rows that were inserted into the table along with the metrics related to any expectations for the table. For example, if records were failed or dropped, they would be tracked here.
Schedule a Pipeline
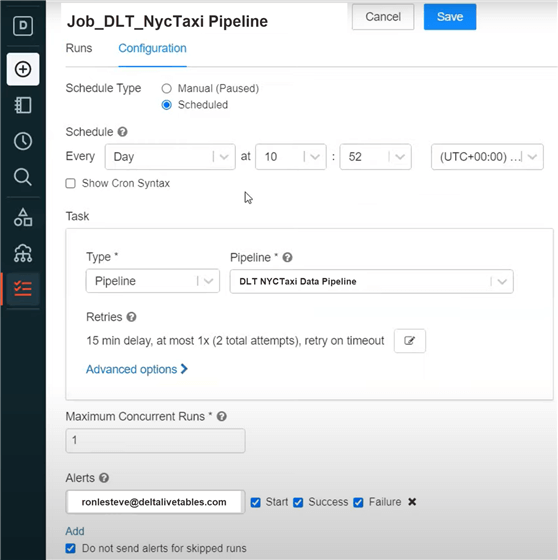
After your pipeline has been created and successfully tested, you can create a job which specifies the Pipeline as a task within the job. You can then customize the schedule, as shown in the figure below, and the configurations even provide the capability of adding custom Cron syntax to the job's schedule. Retries and concurrent runs can be configured as needed. Finally, you'll have the option to customize and send alerts related to job status to a specified email address. Once a scheduled job is setup, a cluster will spin up at the scheduled job time and will run through the steps of the pipeline.
Explore Event Logs
Event logs are created and maintained for all Delta Live Table pipelines and contain data related to the audit logs, data quality checks, pipeline progress, and data lineage for tracking and monitoring your pipelines. As an example, the code below creates a view for the system event metrics for the data that has been processed using the DLT pipeline.
ADLSg2Path = “/mnt/raw/data/NycTaxidata”
df = spark.read.format("delta").load(f"{ADLSg2Path}/system/events")
df.createOrReplaceTempView("dlteventmetrics")
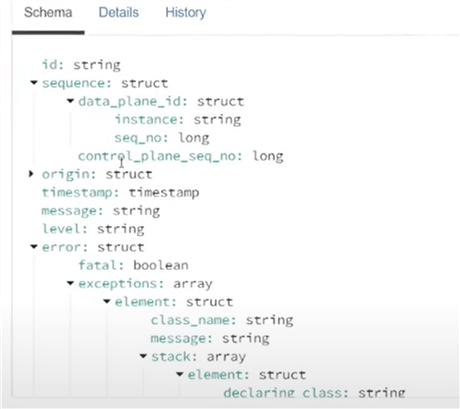
The figure below displays the schema for some of the many fields and nested JSON objects that the pipeline captures which can be used for audit logs, quality checks, pipeline progress, and data lineage.
Once the view is created, you can simply write PySpark or SQL scripts similar to the code shown below to display the metrics related to audit logs.
latest_update_id = spark.sql("SELECT origin.update_id FROM dlteventmetrics WHERE event_type = 'create_update' ORDER BY timestamp DESC LIMIT 1").collect()[0].update_id
spark.conf.set('latest_update.id', latest_update_id)
The figure below illustrates the results of the query shown above. This gives you an idea of some of the metrics and customized queries that you can create based on these DLT system events.

This next query is more complex and can be created on the same view to explode the nested JSON array contents to extract a more customized report on the quality of the data based on the expectations for passing and failing of the rows.
SELECT
  row_expectations.dataset as dataset,
  row_expectations.name as expectation,
  SUM(row_expectations.passed_records) as passing_records,
  SUM(row_expectations.failed_records) as failing_records
FROM
  (
    SELECT
      explode(
        from_json(
          details :flow_progress :data_quality :expectations,
          "array<struct<name: string, dataset: string, passed_records: int, failed_records: int>>"
        )
      ) row_expectations
    FROM
      dlteventmetrics
    WHERE
      event_type = 'flow_progress'
      AND origin.update_id = '${latest_update.id}'
  )
GROUP BY
  row_expectations.dataset,
  row_expectations.name
The figure below shows the results of the query above. These sorts of queries can be used in the Databricks SQL workspace to perform further customized analysis of the data quality, lineage, and audit logs. From a visualization perspective, you can create visually appealing dashboards in either Databricks or Power BI for the reporting of this data.

Summary
As you gain a deeper understanding of Delta Live Tables, it is important to point out a few of its additional features.
- Delta Live Tables support updates to Delta tables only.
- Views in a pipeline from another cluster or SQL endpoint is not supported.
- Delta Live Tables performs maintenance tasks on tables every 24 hours by running the OPTIMIZE and VACCUM commands to improve query performance and reduce cost by removing old versions of tables.
- Each table must be defined once and a UNION can be used to combine multiple inputs to create a table.
- Delta Live tables will retain history for seven days to query snapshots of tables, with the capability of custom defining this retention period.
- As you continue to advance your development of DLT pipelines, you could also parameterize the pipelines to get a robust dynamic framework that is capable of looping through a list of tables to create the pipelines in real time without having to hardcode certain fields.
In this article, you learned more about how to get started with Delta Live Tables using Databricks Notebooks, Pipelines, and Jobs. Delta Live Tables support declarative ELT pipelines that can ingest and transform data sources of all varieties, volumes, and velocities. With Delta Expectations, high data quality and consistency within the Lakehouse can be guaranteed. With scheduled jobs for processing DLT pipelines, recovery and error handling logic can be applied consistently along with robust alerting of job status along the way. Also, visual monitoring of pipeline steps helps with easily tracking status of data flows in the out of box UI. Additional dashboards and metrics can be created to further customize visualizations and reporting of event metrics to further track performance, status, quality, latency, etc. The many capabilities which Delta Live Tables bring to the Lakehouse ELT process allows us to gain quicker insights into valuable data by simplifying and adding robust scheduling and tracking for ELT jobs and pipelines.
Next Steps
- Read more about Delta Live Tables user guide - Azure Databricks | Microsoft Docs
- Read more about Delta Live Tables language reference - Azure Databricks | Microsoft Docs
- Read more about Delta Live Tables settings - Azure Databricks | Microsoft Docs
- Read more about Delta Live Tables cookbook - Azure Databricks | Microsoft Docs
- Read more about Delta Live Tables event log - Azure Databricks | Microsoft Docs
- Read more about When to use dbt or Delta Live Tables? | element61
- Read more about How To Build Data Pipelines With Delta Live Tables - The Databricks Blog
About the author
 Ron L'Esteve is a trusted information technology thought leader and professional Author residing in Illinois. He brings over 20 years of IT experience and is well-known for his impactful books and article publications on Data & AI Architecture, Engineering, and Cloud Leadership. Ron completed his Master’s in Business Administration and Finance from Loyola University in Chicago. Ron brings deep tec
This author pledges the content of this article is based on professional experience and not AI generated.
View all my tips
Article Last Updated: 2022-04-06


