Problem
We use Microsoft Fabric as our data platform to host a data warehouse and a handful of Power BI reports. Is it possible to create some sort of alerting? We want to be notified if one of our stores’ sales drops below a certain threshold. We can probably code something with an Azure Function, but since Fabric is all about software-as-a-service, is there a low-code alternative?
Solution
Microsoft Fabric is a new centralized data platform that combines different types of compute into one unified analytics environment. Almost all experiences have been covered by previous tips (check out the overview), except Data Activator.

Data Activator is a low-to-no-code tool used to act on your data. When one or more conditions are met, an action will be triggered. This can be an e-mail or a Power Automate flow, for example. You can use Data Activator in scenarios such as monitoring product stock in your warehouse and automatically ordering new batches to avoid running out of stock. Or an administrator can use it to monitor real-time data about their network to detect potential breaches and take action when necessary.
In this tip, we’ll explore the possibilities of the Data Activator service using a simple use case. At the time of writing, Data Activator was still in preview, so screenshots or functionality may have changed.
Monitoring Store Sales with Data Activator
Sample Data
Let’s create a small table inside a Fabric Warehouse. If you don’t have one, follow the instructions in the tip: What are Warehouses in Microsoft Fabric? With the following CTAS statement, the table is created:
CREATE TABLE dbo.StoreSales AS
SELECT
     Store = 'A'
    ,SalesDate = CONVERT(DATE,'2023-12-05')
    ,SalesAmount = 120
UNION ALL
SELECT
     Store = 'B'
    ,SalesDate = CONVERT(DATE,'2023-12-05')
    ,SalesAmount = 150
UNION ALL
SELECT
     Store = 'C'
    ,SalesDate = CONVERT(DATE,'2023-12-05')
    ,SalesAmount = 130
UNION ALL
SELECT
     Store = 'A'
    ,SalesDate = CONVERT(DATE,'2023-12-06')
    ,SalesAmount = 125
UNION ALL
SELECT
     Store = 'B'
    ,SalesDate = CONVERT(DATE,'2023-12-06')
    ,SalesAmount = 145
UNION ALL
SELECT
     Store = 'C'
    ,SalesDate = CONVERT(DATE,'2023-12-06')
    ,SalesAmount = 180
UNION ALL
SELECT
     Store = 'A'
    ,SalesDate = CONVERT(DATE,'2023-12-07')
    ,SalesAmount = 105
UNION ALL
SELECT
     Store = 'B'
    ,SalesDate = CONVERT(DATE,'2023-12-07')
    ,SalesAmount = 155
UNION ALL
SELECT
     Store = 'C'
    ,SalesDate = CONVERT(DATE,'2023-12-07')
    ,SalesAmount = 175;
It inserts 9 rows: 3 rows per date for 3 stores.

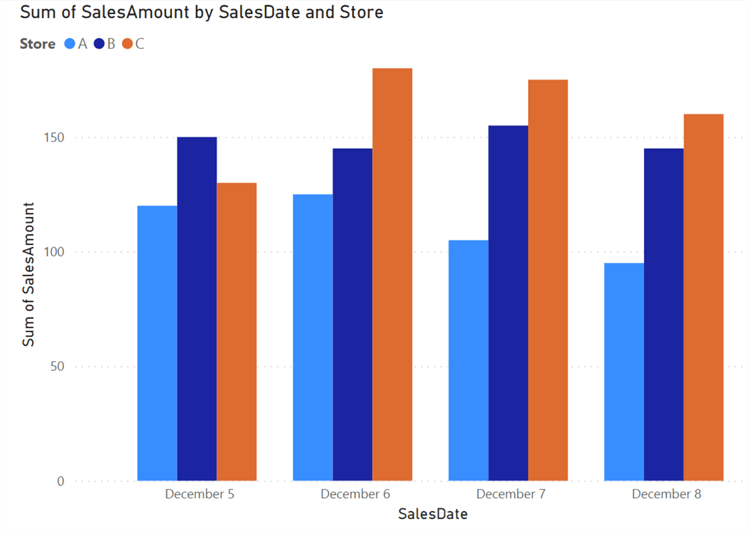
We will monitor the sales amount per store, and if it drops below 100, an alert will fire. To do this, we first need to create a Power BI report. The StoreSales table is added to the default semantic model of the warehouse, which you can see if you click on the Model tab in the left-bottom corner.

While in the model, click on New report to create a new Power BI report. Add a chart with the dates on the X-axis (I changed the display format of the dates and set the X-axis to Categorical), the store on the legend, and the sum of the sales amount on the Y-axis.

Creating a Reflex Item
While you’re in the Power BI report with the visual selected, click on the ellipsis in the top right corner of the visual to see more options.

In the options, choose Set alert.

In the new side panel that appears, you can configure which measure of the visual you want to track and which condition and threshold you want for the alert. You can also set the notification type to either an email or a Teams message.

You’ll also need to select a Fabric workspace and a Reflex item to connect the alert. A Reflex item is an actual object that contains the definition, properties, and configurations to make everything work, while Data Activator is the name of the service. For example, if you switch to the Data Activator persona, you’ll get the option to create a brand-new Reflex item from scratch or a Reflex item with sample data:

In our case, we’re creating a new Reflex item using the Power BI “wizard.”

At the time of writing, a bug prevented the Reflex item from being created. The following error was thrown:
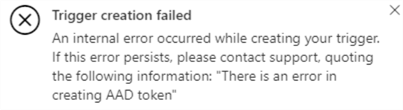
If this error appears, you need to check if the URL of the Power BI report contains “clientSideAuth=0”. If it does, you need to remove it. Hopefully, this bug will be resolved when you’re reading this. Once the trigger has been created, you can check out the Reflex item.

In the screenshot above, we can see some key concepts of a Reflex item:
- Objects. These are business objects that are being monitored by Data Activator. They can be, for example, a parcel, a vehicle, a user session, or, in this case, a store.
- Events. All data sources for Data Activator are streams of events. An event contains an ID for the object, a timestamp, and values for the fields being monitored.
- Trigger. These are the conditions monitored on the object. A trigger will fire for a specific object instance. In our use case, the trigger is “sum of sales amount is less than 100 for a specific store.”

At the end of the trigger definition, we can define the action:

It is possible to define a custom action that will allow you to start a Power Automate flow. Custom actions are out of scope for this tip.
Triggering the Reflex Item
Let’s add some extra data to our warehouse table:
INSERT INTO dbo.StoreSales(Store, SalesDate, SalesAmount)
SELECT
     Store = 'A'
    ,SalesDate = CONVERT(DATE,'2023-12-08')
    ,SalesAmount = 95
UNION ALL
SELECT
     Store = 'B'
    ,SalesDate = CONVERT(DATE,'2023-12-08')
    ,SalesAmount = 145
UNION ALL
SELECT
     Store = 'C'
    ,SalesDate = CONVERT(DATE,'2023-12-08')
    ,SalesAmount = 160;
Since we built our Power BI report using Direct Lake, the data should show up immediately in the report. If it’s not, you might want to refresh the semantic model. More info about Direct Lake can be found in the tip – What is Direct Lake Mode in Microsoft Fabric?
In our last set of rows, Store A has a value lower than 100, so the trigger should be fired. In the Reflex item, we can check if the data has been added by going to the data tab (check the lower left corner).

Since the source is Power BI, this can take some time. You can check the refresh schedule in the right-hand pane:

This will also contain a link to the original Power BI report. In the Reflex editor, we can now see data has been added and that the trigger has been activated once:

Next Steps
- Check out this overview for more Microsoft Fabric tips.
- You can learn more about Data Activator in the official documentation. There’s also a Microsoft Learning Path for Fabric, which contains a module on Data Activator. You’ll find an interesting exercise using the built-in sample data.

Koen Verbeeck is a seasoned business intelligence consultant with over a decade of experience with the Microsoft Data Platform. He holds several certifications, including Azure Data Engineer. He’s a prolific writer, with over 375 articles on technologies such as Microsoft Fabric, SSIS, ADF, SSAS, SSRS, MDS, Power BI, Snowflake and Azure services. He has spoken at various events such as PASS, SQLBits, dataMinds Connect and many others. He frequently delivers educational webinars on MSSQLTips.com. For his efforts, Koen has been awarded the Microsoft MVP data platform award for many years.
- MSSQLTips Awards:
- Leadership Award (200+ Tips) – 2021
- Author of the Year – 2014/2020/2022
- Author Contender – 2024/2025


Love it