Problem
R supports a wide range of machine algorithm libraries. Using R, we can build predictive models, clustering, classification, etc. Once an R script produces output, we need a way to visualize the output and interact to explore the visualizations effectively. R supports a few built-in plot charts, but we need a more sophisticated tool. There is a need to have a unified platform to integrate and execute R scripts with a dashboard to provide advanced visualization and combine the R output with other data in the dashboard.
Solution
In Power BI, we can integrate R scripts, create interactive visualizations and perform data modeling. In this tip, I will show you a way to perform ‘Market Basket Analysis’ using R, by executing an R script in Power BI and create visualizations of the R output in Power BI. The example in this tip is based on the Adventureworks2016 CTP3 database.
Market Basket Analysis
Market Basket Analysis is based on the theory that if a customer buys a product or group of items, there is a high chance to buy another set of products or group of items. For example, if you buy a bike there is more a better chance to also buy a helmet.
Data Preparation for Market Basket Analysis
Here, I am connecting to the AdventureWorks database to pull all product categories bought by all customers. You can download the AdventureWorks database and run the below command in SQL Server Management Studio to restore the database.
RESTORE DATABASE AdventureWorks FROM DISK = 'C:\AdventureWorks.BAK'
Now run the below query in the AdventureWorks database to a get list of ProductSubcategories bought by customers.
DECLARE @cols AS NVARCHAR(MAX)
DECLARE @Query AS NVARCHAR(MAX)

select @cols = STUFF((SELECT distinct ',' + QUOTENAME(ProductSubcategoryID)
                    from [Production].[ProductSubcategory]

            FOR XML PATH(''), TYPE
            ).value('.', 'NVARCHAR(MAX)')
        ,1,1,'')

select @Query   ='
select * from
(
select distinct oh.CustomerID,ps.ProductSubcategoryID,ps.Name as SubCategoryName
from [Sales].[SalesOrderHeader] oh inner join [Sales].[SalesOrderDetail] od on oh.SalesOrderID=od.SalesOrderID
inner join [Production].[Product] p on od.ProductID=p.ProductID
inner join [Production].[ProductSubcategory] ps on  ps.ProductSubcategoryID=p.ProductSubcategoryID
) p
Pivot
(
Max(p.SubCategoryName)
for p.ProductSubcategoryID in ('+@cols+')
)
p'

execute sp_executesql @query;
Once you execute the above script, you will see data in the below format. The data shows customer ID ‘16512’ has bought a Mountain Bike and Road Bikes. Customer ‘29041’ has bought Road Bikes, Gloves and Jerseys. In this data, Mountain Bikes, Road Bikes, Gloves, Jerseys are product categories and the columns 1,10,11, etc. are the Product Category IDs, where the first column represents the ‘CustomerID’.

In the above script, I formatted the data in way that the R machine learning library can easily consume without the need of data manipulation in R. If you want, you can use another approach to connect the database from R and perform data massaging in R.
Now export the above SQL output with the header to a CSV file. From the CSV file, replace the NULL values with blank, so the R algorithm will not consider NULL as product category. You can perform this step in the R script too if you want.
After NULL replacement, the CSV file looks like below.

Market Basket Analysis in R
To discover similar products bought by customers, I am using the ‘apriori’ algorithm in R. You need to install R and R studio, before using the ‘apriori’ algorithm and you have to install the ‘arules package’. The ‘arules package’ has functions to read transactions and find association rules. Run the install.packages(“arules”) command in R to install the package.
Now execute the below scripts in R studio.
require(arules)
customerProductfile=read.transactions("C:/Study/R/Association/ProductAssociation.csv",sep=",")
customerProductfile<-customerProductfile[-1,]
Rule<-apriori(customerProductfile,parameter = list(support=0.04,confidence=0.2,minlen=2,maxlen=4))
df=data.frame(lhs=labels(lhs(Rule)),rhs=labels(rhs(Rule)),Rule@quality)
The ProductAssociation.csv is the file generated by running the SQL scripts. The algorithm does not need column headers, so by using [-1], I removed the column header and then used the apriori function to calculate the product association.
The support parameter indicates the percentage of items existing in the dataset. For example, in the above dataset, we have a total of 19,119 customers and out of 19,119 customers, 2,053 customers have bought Mountain Bikes and Road Bikes, so the support is 10%.
Support = Number of transactions with both Mountain Bikes and Road Bikes / Total number of transactions
The confidence parameter indicates the percentage of probability to buy a certain item, considering you have another specific item in the basket. For example, 4,300 customers have bought Mountain Bikes. Out of these 4,300 customers, 2,053 customers have bought Road Bikes, so the probability of customers buying Road Bikes, considering they bought Mountain Bikes is 47%.
Confidence = Number of transactions with both Mountain Bikes and Road Bikes / Total number of transactions with Mountain Bikes
In above example, I am saying Support=0.04 and Confidence=0.2. This means the output rules should have a minimum support of 4% and confidence of 20%. The minlen and maxlen parameters are used to control the length of rules. Based on the input parameter values, the algorithm calculates Support, Confidence and lift value for each combination of products.
Lift is a factor which indicates having items together increases the chance of a sale. So, the higher the Lift number, the better chance of items occurring together.
In last line, I have the output in data frame. You will be surprised to see the product association using a few lines of code, but you have to understand your data and carefully use support, confidence, minlen and maxlen parameters to get correct output. There are also test scenarios available to validate the model output. In this tip, I am not covering the test scenario and we will quickly move towards R integration in Power BI.
R integration in Power BI
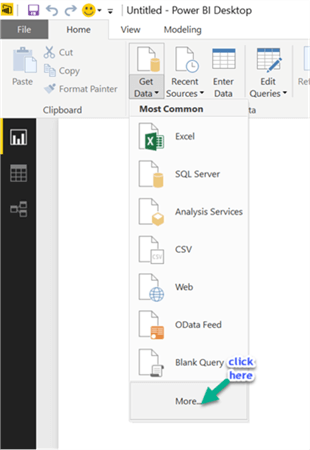
To integrate the R script, open Power BI Desktop and click on the Get Data menu item. In the menu, you will see multiple options to connect to various data sources.
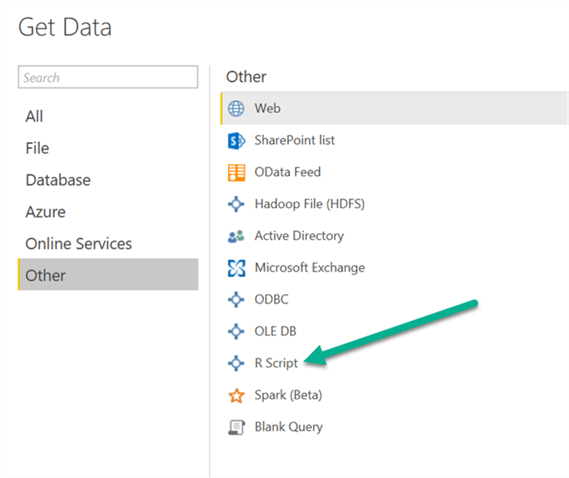
In left panel, you will see the Other option. Click on Other and you will see R Script on the right menu. Select R Script and click connect.
A new R Script window will open, copy your R studio script into the R Script editor.
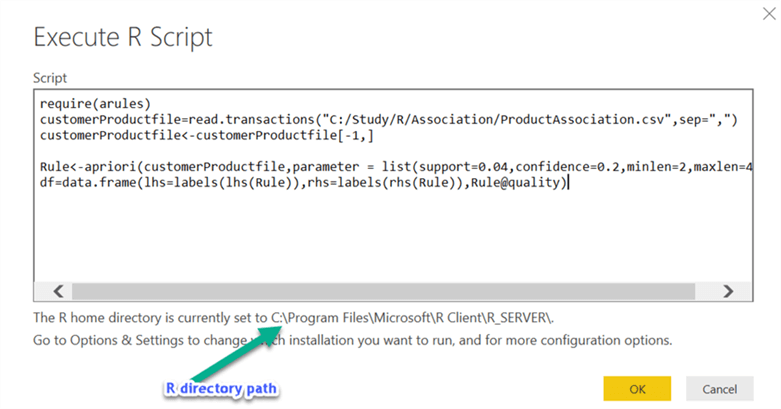
In the above window, you can see the R client path used by Power BI. If you want to change the path, go to options and settings and change the home directory path.

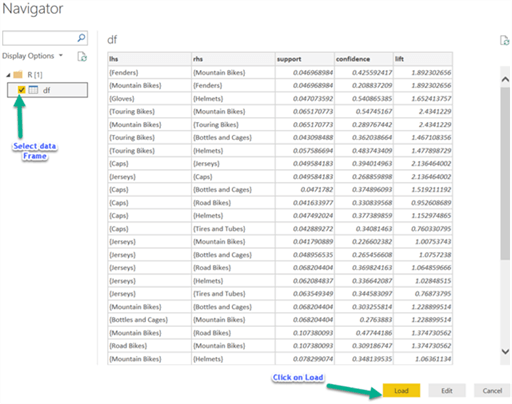
Click OK on the Execute R Script editor to execute the R script in Power BI and you will see a R data frame in Power BI. Select the data frame df and click on the Load button to load data into Power BI.
We need to rename a few columns to meaningful names and we need to remove curly braces from the dataset. All these changes are easy to do in Power BI. From the right-side panel, click on data and start modifying the fields.
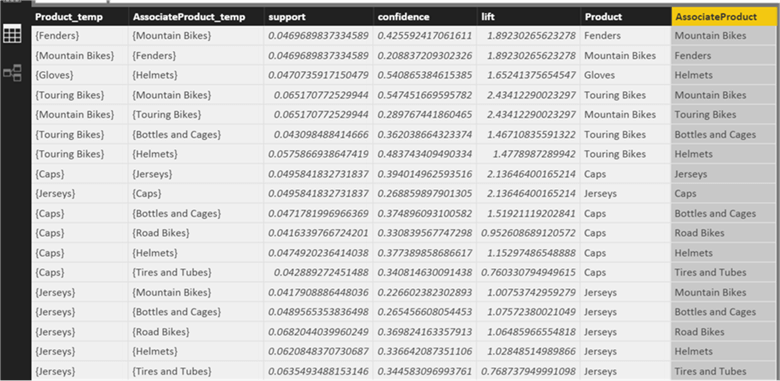
Here I have renamed the lhs column to Product_temp, rhs product to AssociateProduct_temp. I created 2 new derived columns.
Product = SUBSTITUTE(SUBSTITUTE(df[Product_temp],"{",""),"}","")
AssociateProduct = SUBSTITUTE(SUBSTITUTE(df[AssociateProduct_temp],"{",""),"}","")
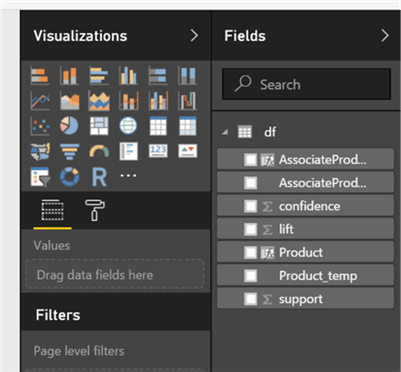
From the left menu, click on Report to create the visualization. You will see the below fields in Power BI.
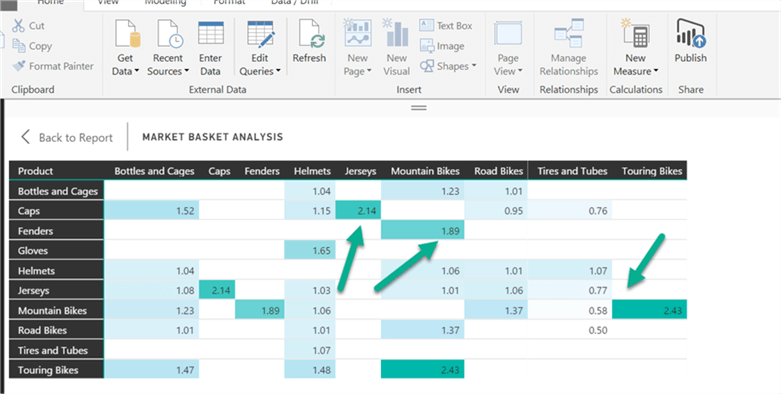
In Power BI, you have various visualization options available. You can also add custom objects built by someone else or you can create and add your own visualizations. Here I am using a Matrix chart to show Product as rows, Associate Product as columns and the Lift field as values. Now, the chart looks like the one below.
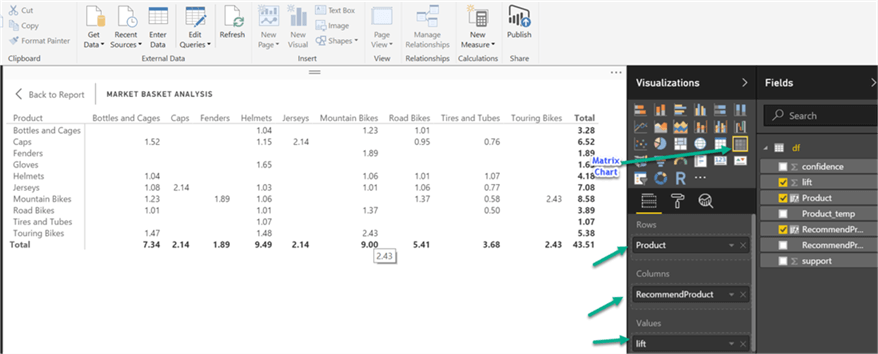
This looks ok, but we need to look at numbers very carefully to get meaningful information. Ideally our visualization should display information in an intuitive way. We should get data insights with just a glance at the chart. Power BI is a powerful visualization tool and it has many UI features. Let’s use a few of these features to make the chart more meaningful.
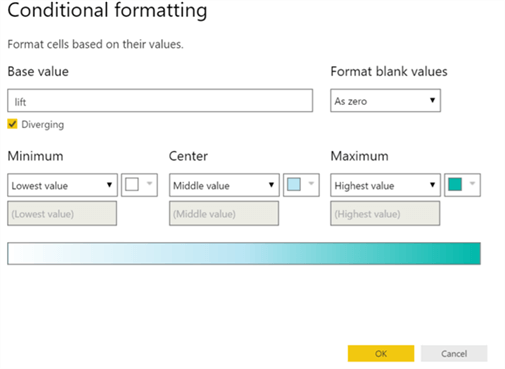
Click on Lift and select conditional formatting.
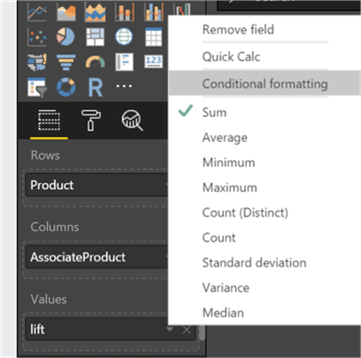
Select the below formatting colors and click OK.
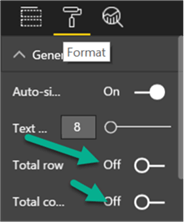
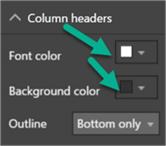
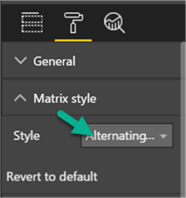
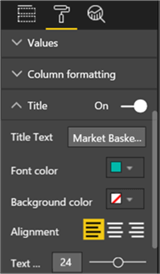
Now, I want to hide totals from columns and rows, change Matrix style and add a chart title.
After making the above changes, the chart looks like the below image. As per the varying colors, the darker the cell, the higher the chance of getting items to be sold together.
Next Steps
- In Power BI, we can easily integrate and execute an R script. Once we get R output in Power BI, we can create an advanced visualization and data modeling in Power BI.
- In Power BI, we can add data from another data set and combine two data sets which can make dashboards interactive.
- Take a look at some of below topics.

Saurabh Desai is a Business Intelligence Architect and Data Scientist in the Investment Banking industry helping firms build analytics and data science platforms. He has 15+ years of experience in building data marts and architecting analytics platforms.
He has in-depth experience in Qlikview, Tableau, Power BI, R, Python, SQL and Hadoop technologies. He has developed platforms using the Microsoft BI stack (Data ware house in SQL, cubes in SSAS, reports in SSRS, ETL in SSIS, etc.). He has also built applications using ASP.NET, C# and MVC frameworks.
In his spare time, he writes articles on different technologies.

Hello, excellent work. I tell you that I get this error when executing the R script.
> df=data.frame(lhs=labels(lhs(Rule)),rhs=labels(rhs(Rule)),Rule@quality)
Error in data.frame(lhs = labels(lhs(Rule)), rhs = labels(rhs(Rule)), :
arguments imply differing number of rows: 1, 0