By: Nai Biao Zhou | Comments (2) | Related: > Reporting Services Development
Problem
A simple, tabular SSRS report introduced in tip [1] may not satisfy some business requirements. Under certain circumstances, we want to present data in groups in order to improve understandability. These grouped reports organize data into multiple levels and place totals, such as sums or averages, at the end of each level. We expect a tutorial that provides just enough steps to build a ready-to-use SSRS report with multiple row grouping levels.
Solution
This tip provides a step-by-step procedure to create an SSRS report shown in Figure 1 with multiple row grouping levels. The demonstration report loads data from the AdventureWorks sample database "AdventureWorks2017.bak" [2]. We assume business requirements for building the report:
The sales department at AdventureWorks would like to have a report to summarize sales in a certain period. When report users view the report, they should be able to select a period. The report should include product name, sales amount, tax amount, freight, and extended sales amount. The report should group summary information by product category and then by product subcategory. At the end of each group in the report, we should place subtotals. Additionally, report users can print a letter-sized report.
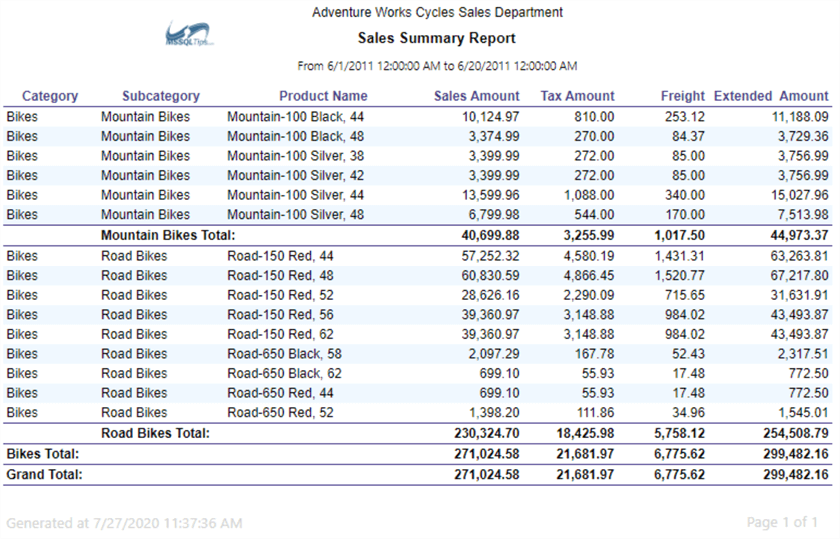
Figure 1 Adventure Works Sales Summary Report
I organized this article into four sections. In Section 1, we create a data source for a report. We cover a step-by-step process to design a ready-to-use report with multiple grouping levels using Visual Studio 2019 in Section 2. Section 3 introduces techniques to build configurable reports. Next, in Section 4, we explore methods to add images to report canvas.
I created this report with Microsoft Visual Studio Community 2019 and Azure Data Studio 1.19.0 on Windows 10 Home 10.0 <X64>. The DBMS is Microsoft SQL Server 2017 Enterprise Edition (64-bit)
1 – Preparing Data Sources for the Report
We should create data sources for SSRS reports from which the SSRS loads report data. As a best practice, reports should share data sources [3]. In this exercise, we use SQL Server relational database as the data source to the report. The SSRS also supports other data source types, such as Microsoft SQL Server Analysis Services, Microsoft Azure SQL Database, Oracle, OLE DB, and XML [4].
1.1 Create a Stored Procedure to Extract Data
We use stored procedures to load report data from the SQL server database. DBAs only need to grant EXECUTE permissions on these stored procedures without having a risk of exposing underlying tables [5]. Besides, we put all business logic in stored procedures; therefore, the report, like the view component in the MVC pattern, solely display data to report users.
According to the business requirements, we should load the following data into the report: sales amount, tax amount, freight, product name, product subcategory, and product category. The extended sales amount is the sum of sales amount, tax amount, and freight. We compute this amount in the report designer to demonstrate how to use SSRS expressions. To avoid duplicate names, we extract unique identifiers associated with these names as well. We create a stored procedure "[dbo].[uspGetSalesSummary]" to retrieve these data:
CREATE PROCEDURE [dbo].[uspGetSalesSummary]
   @StartDate datetime
   ,@EndDate  datetime
AS
BEGIN
   BEGIN TRY
        SELECT   PC.[Name]                      AS Category
                ,PS.[ProductCategoryID]
                ,PS.[Name]                      AS Subcategory
                ,PS.[ProductSubcategoryID]
                ,P.[Name]                       AS ProductName
                ,P.[ProductID]
                ,SUM([LineTotal]) as SalesAmount
                ,SUM([LineTotal]*SOH.[TaxAmt]/SOH.[SubTotal])  AS TaxAmount
                ,SUM([LineTotal]*SOH.[Freight]/SOH.[SubTotal]) AS Freight
        FROM    Sales.SalesOrderDetail DET
        INNERJOIN  Sales.SalesOrderHeader SOH ON DET.SalesOrderID = SOH.SalesOrderID
        INNERJOIN  Production.Product P ON P.ProductID = DET.ProductID
        INNERJOIN Production.ProductSubcategory PS ON PS.[ProductSubcategoryID] = P.[ProductSubcategoryID]
        INNERJOIN Production.ProductCategory PC ON PC.ProductCategoryID = PS.ProductCategoryID
        WHERE SOH.OrderDate BETWEEN (@StartDate) AND (@EndDate)
        GROUPBY P.[ProductID]
                ,P.[Name]
                ,PS.[ProductSubcategoryID]
                ,PS.[Name]
                ,PS.[ProductCategoryID]
                ,PC.[Name]
        ORDERBY PC.[Name], PS.[Name], P.[Name]
   END TRY
   BEGIN CATCH
        DECLARE @ErrorMessage NVARCHAR(4000);
        DECLARE @ErrorSeverity INT;
        DECLARE @ErrorState INT;
        SELECT @ErrorMessage = ERROR_MESSAGE(),
                @ErrorSeverity = ERROR_SEVERITY(),
                @ErrorState = ERROR_STATE();
        RAISERROR (@ErrorMessage, @ErrorSeverity, @ErrorState );
        RETURN 1
    END CATCH
    RETURN 0
END
GO
1.2 Create a Shared Data Source
To configure database connections for reports in a central place, we create shared data sources for all reports.
1.2.1 Create a Report Server project
Create an empty Report Server Project in Visual Studio 2019 by selecting the "Report Server Project" template, as shown in Figure 2. Then, click on the "Next" button and follow instructions on the screen to create the report server project.
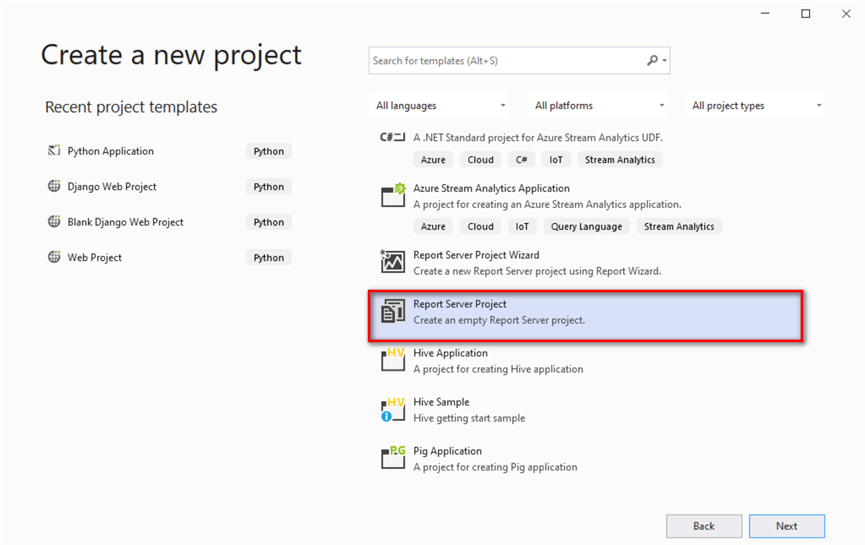
Figure 2 Create a Report Server Project in Visual Studio 2019
The Solution Explorer panel should look like Figure 3. The project has three folders. As of this writing, we cannot create a subfolder under the report server project. If we want to keep our reports well-organized, such as all sales reports in one folder and all accounting reports in another folder, we should create different projects for different reporting groups, respectively.
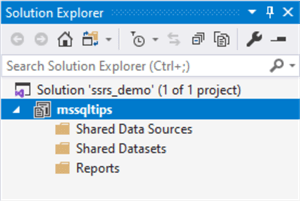
Figure 3 The Folder Structure of the Report Server Project in the Solution Explorer Panel
Right-click on the project name "mssqltips" to bring up the context menu and select the "Properties" item. The project property pages should look like Figure 4. We ensure that the "TargetServerURL" property points to a report server. We find the report server address from the "Report Server Configuration Manager" tool or ask the database administrator (DBA) who installed the SSRS. Other properties in Figure 4 take default values.
It is worth noting that the default values of "OverwriteDatasets" and "OverwriteDataSources" are "False." IT professionals who deploy reports may not undertake a task to manage these reports in a company. After report deployment, we pass the control of reports to report managers. Some may overlook the boundary line between report development and report management. Note that the report deployment should not overwrite any report management configurations.
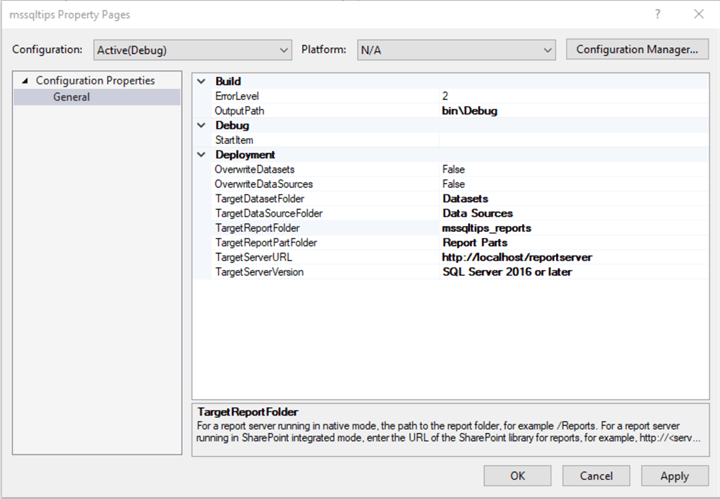
Figure 4 The Report Server Project Property Pages
1.2.2 Add a Shared Data Source
Right-click on the "Shared Data Sources" folder in the "Solution Explorer" panel and select the "Add New Data Source" item from the context menu. The "Shared Data Source Properties" dialog appears. We enter a value of "mssqltips_datasource" for the "Name" box; the dialog should look like Figure 5.
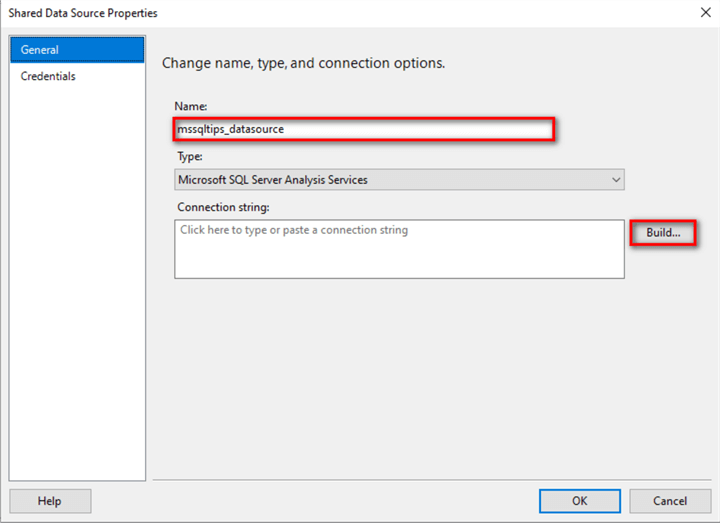
Figure 5 Create a Shared Data Source for the Report Server Project
Click on the "Build…" button in the "Shared Data Source Properties" dialog, and another dialog appears. Select a data source type, a server name, and a database name. Then, the "Connection Properties" dialog should look like Figure 6. In the dialog, click on the "Test Connection" button to verify the database connection.
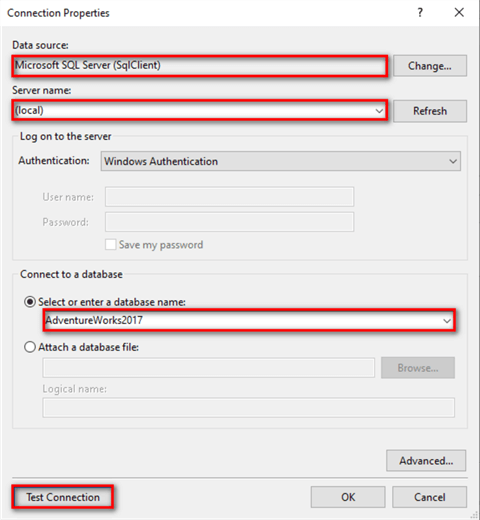
Figure 6 Setup the Database Connection
Click on the button "OK" in the "Connection Properties" dialog to close the dialog. We notice that the "Connection string" box in the "Shared Data Source Properties" dialog has an autogenerated string. Click on the "OK" button to close the dialog. The shared data source shows up in the "Shared Data Sources" folder, as exhibited in Figure 7.
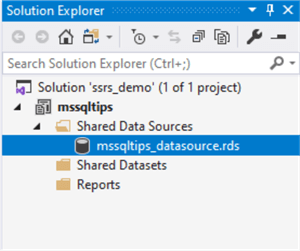
Figure 7 The Shared Data Source in the Project Folder
2 – Designing the Report Layout
Business users usually operate in a mode of discovery [6]. They will have more specific requirements only when they see reports. This fact determines that creating reports is an iterative process. We create a report based on gathered requirements and quickly deliver the report to business users for verification. We modify the report according to users’ feedback. This process repeats until all agree on what the report should look like and how it should work.
After we complete this report, we can use this report as a template. We usually do not start designing a report from scratch. We can either reference existing reports or consult business users for report layouts. When we have many templates, we ask business users to pick one of them as the starting point. The usage of report templates shortens our development time.
2.1 Add a New Letter-Sized Report
Some advanced features of SSRS are not available when we use the wizard [3]. If we have never used SQL Server Reporting Services, this wizard helps us quickly create a report and taste SSRS. In practice, we create a report from a blank canvas rather than running the wizard.
2.1.1 Add a New Report to the Project
Right-click on the folder "Reports" in the "Solution Explorer" panel, select "Add > New Item…" item from the context menu, as shown in Figure 8.
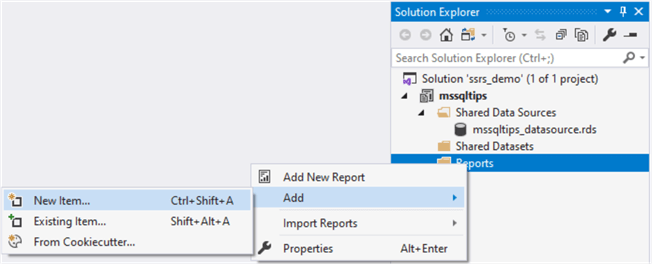
Figure 8 Select "Add > New Item" from the Context Menu
The "Add New Item" dialog appears, as shown in Figure 9. Select the "Report" item and enter "Sales_Summary_Report" for the "Name" box.
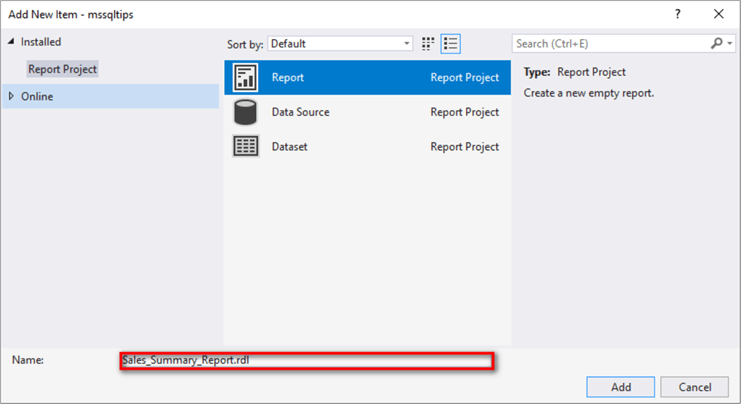
Figure 9 Select "Report" Item from the Dialog to Add a New Report
Click on the "Add" button in the dialog. The new report, "Sales_Summary_Report," is added into the project. The design canvas of the report should look like Figure 10.
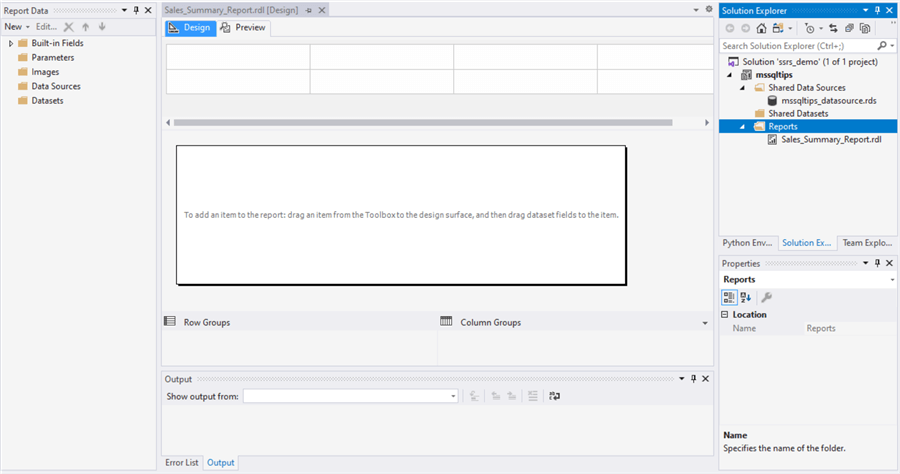
Figure 10 The Design Canvas of the New Report
2.1.2 Arrange the Report Layout
Switch to the "Design" tab. Click on any area in the canvas; the "Extension" menu on the top of Visual Studio 2019 includes a menu item "Report," as shown in Figure 11. Click on menu items "Add Page Header" and "Add Page footer" to add a header section and a footer section to the report.
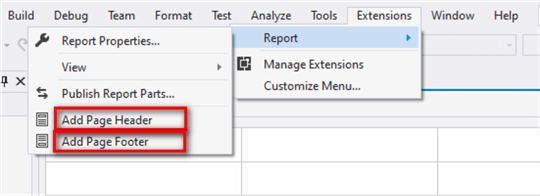
Figure 11 Add a Header and a Footer to the Report
Click on the menu item "Report Properties…" from the "Extension > Report" pull-down menu list to bring up the "Report Properties" dialog. In the dialog, select "Letter" from the page size drop-down list. Set margins and other report properties, as shown in Figure 12. We may increase margins to 0.5in if the printer at our work environment does not support narrow margins(i.e.,0.25in).
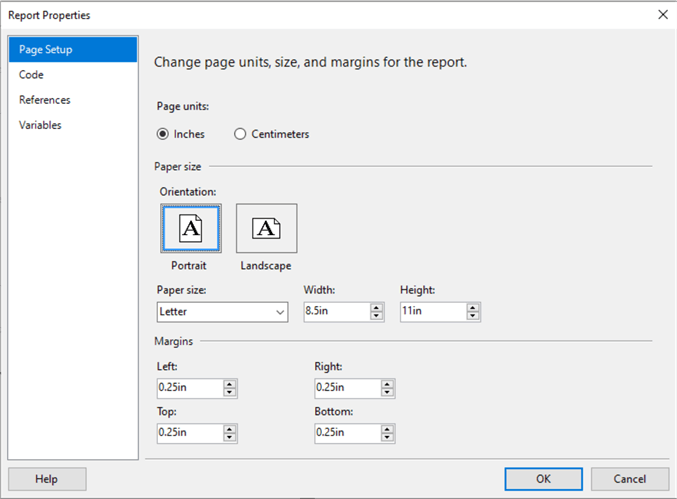
Figure 12 Set Report Properties
Click on the "OK" button to close the "Report Properties" dialog. As shown in Figure 13, the report has three sections: report header, report body, and report footer. We can move the dotted line to change the height of each section.
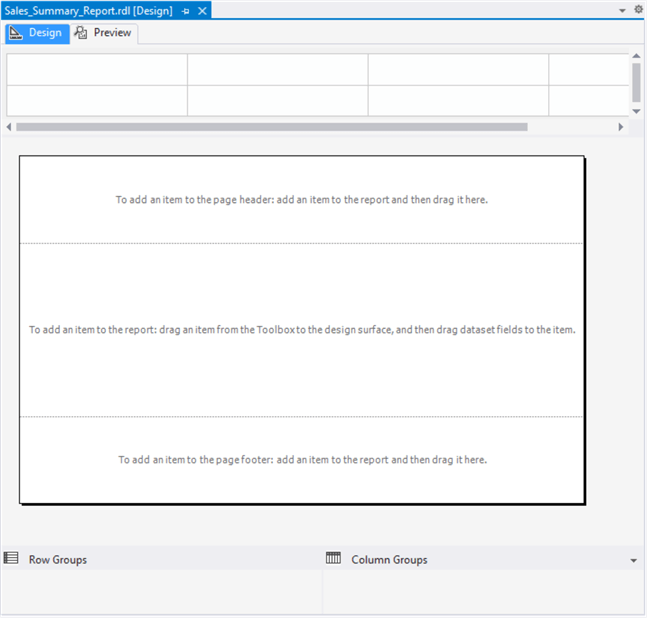
Figure 13 The Header Section, Body Section and Footer Section in the Report
From the page configuration in Figure 12, we know the maximum width of the report is 8.0in (=8.5-0.25-0.25). We set the report width with a value of 7.96in. Click on an empty area in the report body. In the "Properties" panel, change the body width to 7.96in, as shown in Figure 14. When the report has extra blank pages in the PDF format, we can decrease the report body width to solve this issue. We should keep this size in mind. When we add new objects into the report, the width may increase automatically without any notification.
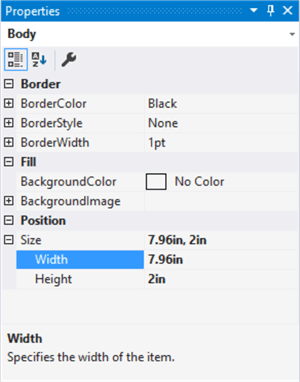
Figure 14 Set the Report Body Size
2.1.3 Add the Shared Data Source to the Report
Right-click on the "Data Sources" in the "Report Data" panel. Select the "Add Data Source…" command from the context menu, as shown in Figure 15.
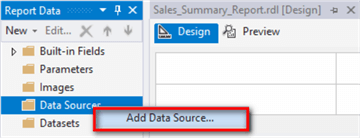
Figure 15 Add a New Data Source to the Report
The "Data Source Properties" dialog appears. Enter a value of "mssqltips_datasource" for the name box. Select "Use shared data source reference" and then select "missqltip_datasource" from the dropdown list. The dialog should look like Figure 16. Click on the "OK" button to close the dialog. The data source "mssqltips_datasource" appears under the "Data Source" folder in the "Report Data" panel and, then, the report can use the shared data source.
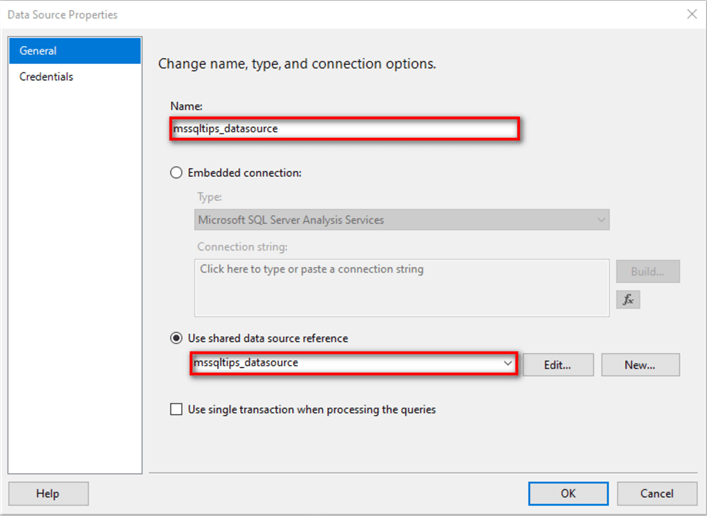
Figure 16 Add the Shared Data Source to the Report
2.1.4 Add Datasets to the Report
Right-click on the "Datasets" in the "Report Data" panel. Select the "Add Dataset…" command from the context menu, as shown in Figure 17.
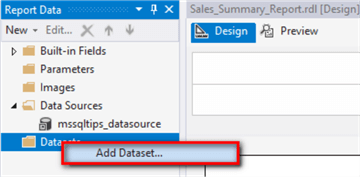
Figure 17 Add a New Dataset to the Report
The "Dataset Properties" dialog appears. We use a dataset embedded in the report; therefore, we select "Use a dataset embedded in my report." Select the shared data source "mssqltips_datasource" as the report data source, and choose "Stored Procedure" as the "Query type." Pick the stored procedure "uspGetSalesSummary" from the dropdown list. We also use the stored procedure name as the name of the dataset. The "Dataset Properties" settings should look like Figure 18. Click the "Refresh Fields" button to verify the database connection. We can switch to the "Fields" tab to view a list of fields in this dataset. Click the "OK" button to close the dialog.
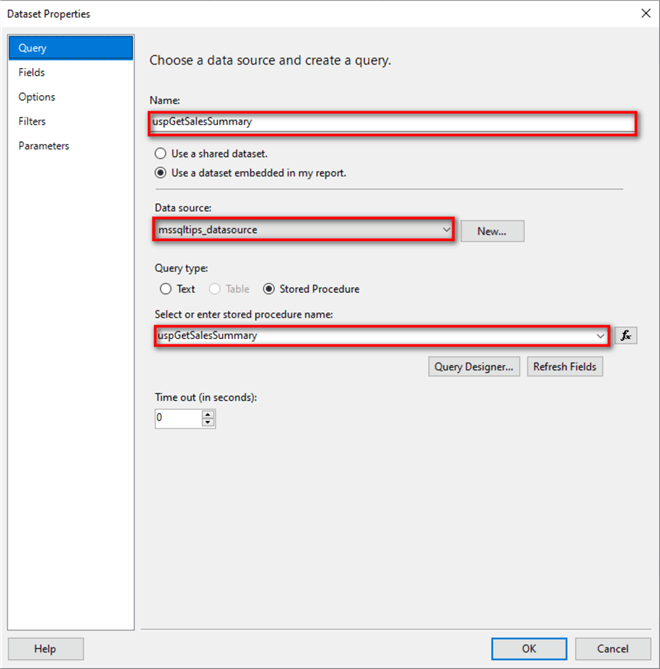
Figure 18 Add a Dataset to the Report
The "Report Data" panel should look like Figure 19. In this exercise, the report data contains one dataset. A report can have several datasets. Using a stored procedure name to be the corresponding dataset name, we can quickly identify which stored procedure load data to the dataset.
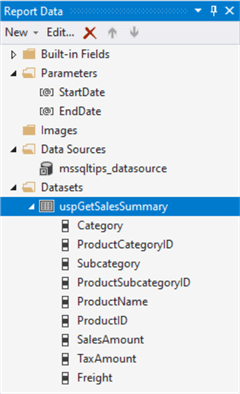
Figure 19 The Dataset in the Report
When we create a dataset from the stored procedure "uspGetSalesSummary," the use of the stored procedure triggers the creation of report parameters "StartDate" and "EndDate," as shown in Figure 19. Right-click on the dataset "uspGetSalesSummary" and select the "Dataset Properties" from the context menu. Choose the "Parameters" tab in the "Dataset Properties" dialog. As shown in Figure 20, the report parameters map to stored procedure parameters, respectively.
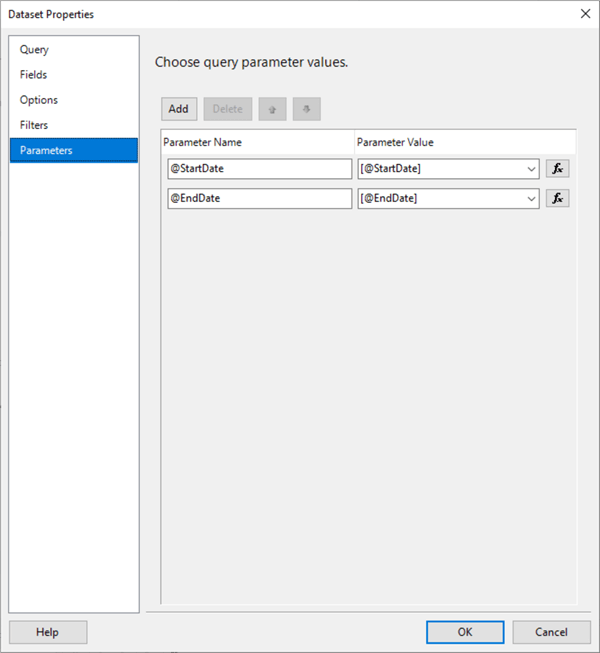
Figure 20 The Report Parameters Map to the Stored Procedure Parameters
2.2 Assign Default Values to Parameters
As a best practice, we add a default value for each report parameter. When building the report, we frequently preview the report. With default values, we do not need to specify values for these parameters whenever launching the report. This trick saves development time. Report users may also want to have default values for these report parameters.
Figure 19 indicates that the report has two parameters: StartDate and EndDate. Double click on the parameter name "StartDate" to bring up the "Report Parameter Properties" dialog. Switch to the "Default Values" tab. The dialog should look like Figure 21.
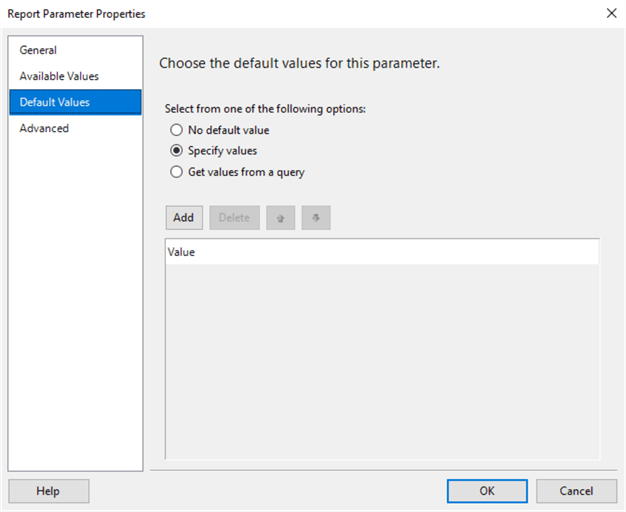
Figure 21 The Report Parameter Properties Dialog
Click on the "Add" button in the "Report Parameter Properties" dialog, and enter a value of "2011-01-01" as the default value of the parameter "StartDate." The dialog should look like Figure 22.
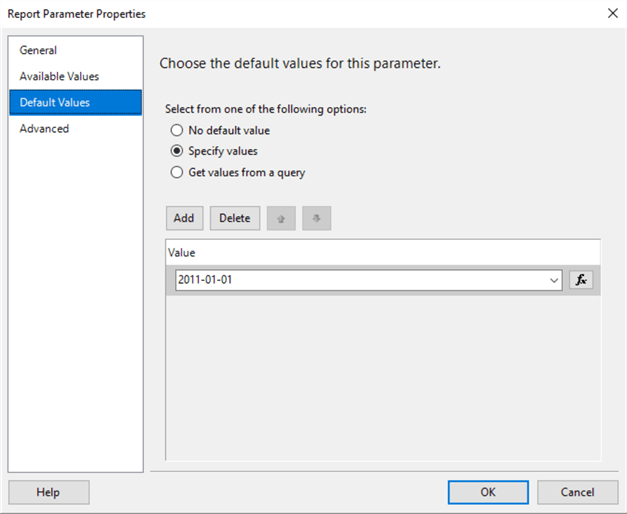
Figure 22 Assign a Default Value to the Parameter
Click on the "OK" button to close the "Report Parameter Properties" dialog. The report designer automatically transforms the string value to a date-time value because the data type of this parameter is date/time. We repeat the default value assignment process and assign a default value of "2014-12-31" to the parameter "End Date." Switch to the "Preview" tab. As shown in Figure 23, the two parameters have default values. If we want to pick another date for the "Start Date," we click on the calendar icon to bring up a calendar dialog then choose the date.
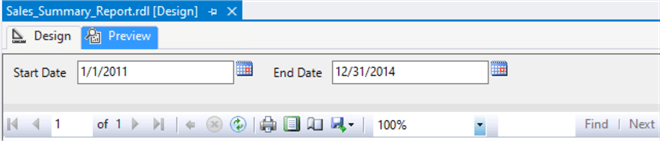
Figure 23 Preview Report Parameter Default Values
2.3 Place a Table Data Region on the Report
The report designer provides several templates such as a table template, matrix template, and list template to organize data into rows and columns. These templates are data regions in SSRS. The table template can include row groups, and the matrix template can have both row and column groups [7]. The list template can provide more free-style layout design, but they need more design effort. Since the report in this exercise does not include any column group, we use the table data region.
2.3.1 Drag a Table Data Region to the Report
Switch to the "Toolbox" panel. Drag the "Table" item over the report body in the "Design" tab, and drop it. Select the table in the "Design" tab, and the "Properties" panel should look like Figure 24. In the default setting, the table has two rows: a table header row and a data row.
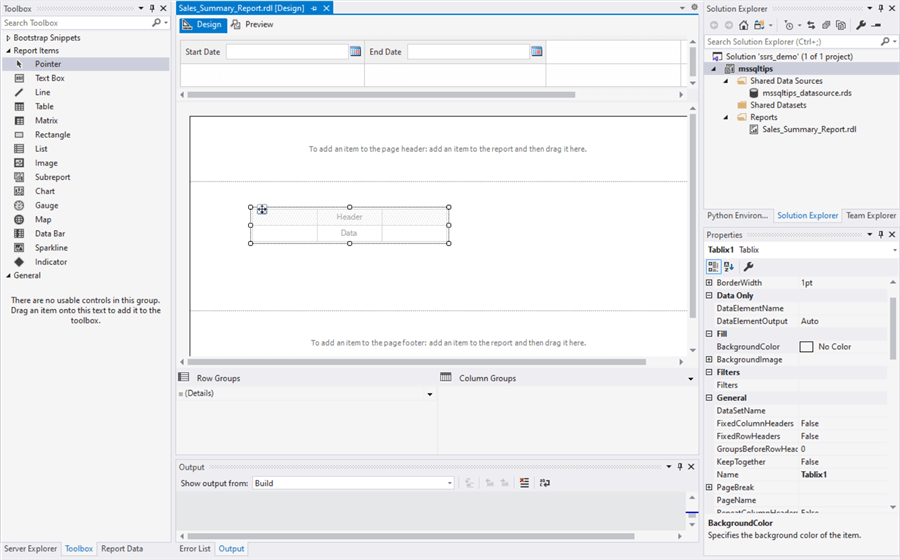
Figure 24 Add a Table Data Region to the Report Canvas
With the table selected, we go to the "Properties" panel to make the changes in the "Properties" panel according to Table 1. We immediately observe that the table moves to top-left in the report body section.
| Property | New Value |
|---|---|
| Name | tbl_Sales_Summary |
| DataSetName | uspGetSalesSummary |
| Font: FontFamily | Arial |
| Font: FontSize | 9pt |
| Location: Left | 0.05in |
| Location: Top | 0.05in |
| RepeatColumnHeaders | True |
Table 1 Change the Table Properties
2.3.2 Add New Columns to the Table
The table has three columns in the default settings. The report has seven columns: product category, product subcategory, product name, sales amount, tax amount, freight, and extended sales amount. Therefore, we need to add four more columns.
Right-click on the middle column of the table and select the "Insert Column > Right" item, as shown in Figure 25.
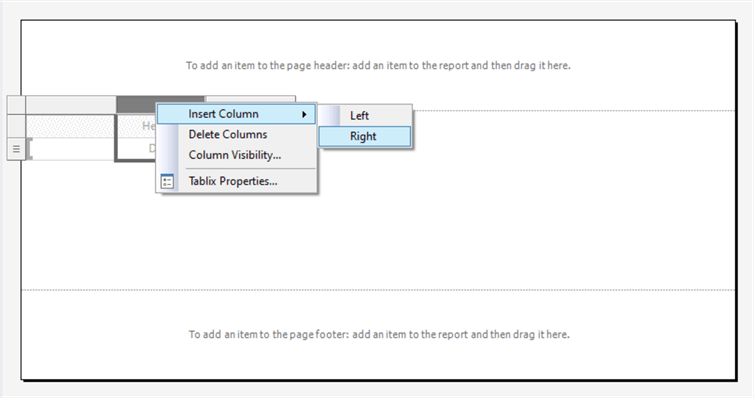
Figure 25 Add New Columns to the Table
Repeat the "Insert column" step to add four columns into the table. We find the report body width increases automatically when the table expands beyond the report body’s right boundary. We will set the width of the column, table, and report body later. When we move the cursor over the data cell, an icon representing the field selector appears. Clicking on the icon, a list of fields in the dataset appears, as shown in Figure 26.
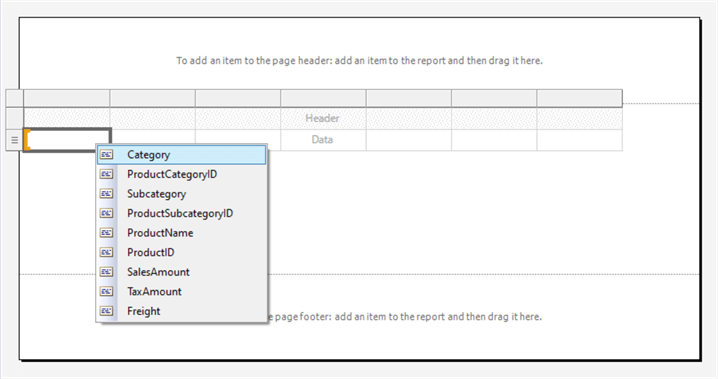
Figure 26 The Field Selector
Select one field from the field selector for each data cell. The last column is the column "Extended Sales Amount." We will use the "Extended Amount" as the column header and compute this column’s value using expression [8]. The table should look like Figure 27.
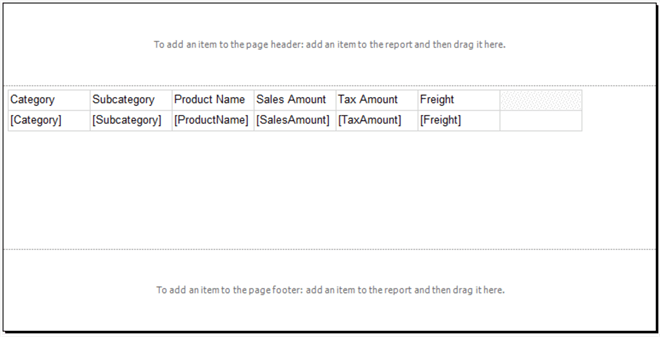
Figure 27 Add Data Columns into the Table
Switch to the "Preview" tab. The report should look like Figure 28. We can select a different date range and then click on the "View Report" button to review data in a different period. We also have a sense of how to arrange column width according to the content in cells.
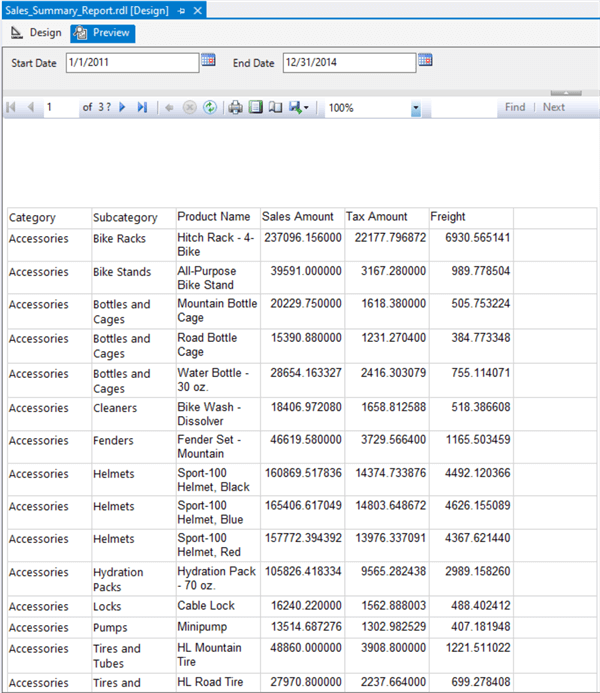
Figure 28 The First Glance of the Report
2.3.3 Add Grouping Levels to the Report
We added detail rows into the report. According to the business requirements, we should group the detail rows by product category and then by product subcategory. Several methods are available to add grouping levels; we use the "Row Groups" panel. Right-clicking on any empty area in the report body, a context menu appears, as shown in Figure 29. We can display the "Row Groups" panel by selecting the menu item "View > Grouping."
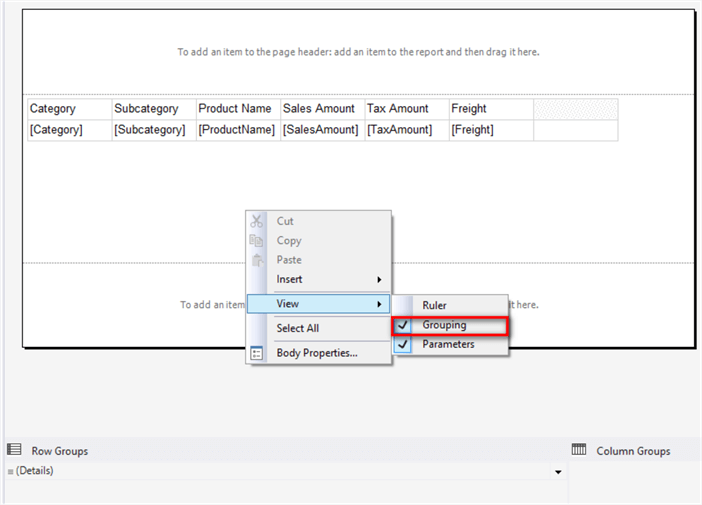
Figure 29 Display the Row Groups Panel
Click on the down arrow shown in Figure 30. We select the menu item "Add Group > Parent Group" in the pull-down menu list.
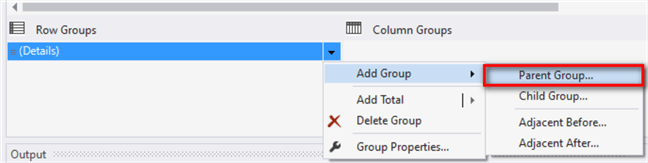
Figure 30 Add a Parent Group to the Report
The "Tablix group" dialog appears. We group the rows by "ProductSubcategoryID." Since we want to add subtotal at the end of each group, we add a group footer. The dialog should appear like Figure 31. Since the name may change or duplicate, we group rows by the product subcategory ID rather than the product subcategory name.
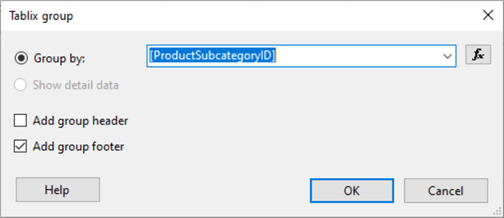
Figure 31 The Tablix Group Dialog
Click on the "OK" button to add the group; the canvas should look like Figure 32. When we select any cell in the second row, for example "ProductName," we observe an orange bracket on the left of the "Category" cell. This orange bracket indicates the grouping level of the selected cell [3]. As illustrated in Figure 32, the "ProductName" cell is in at the detail level.
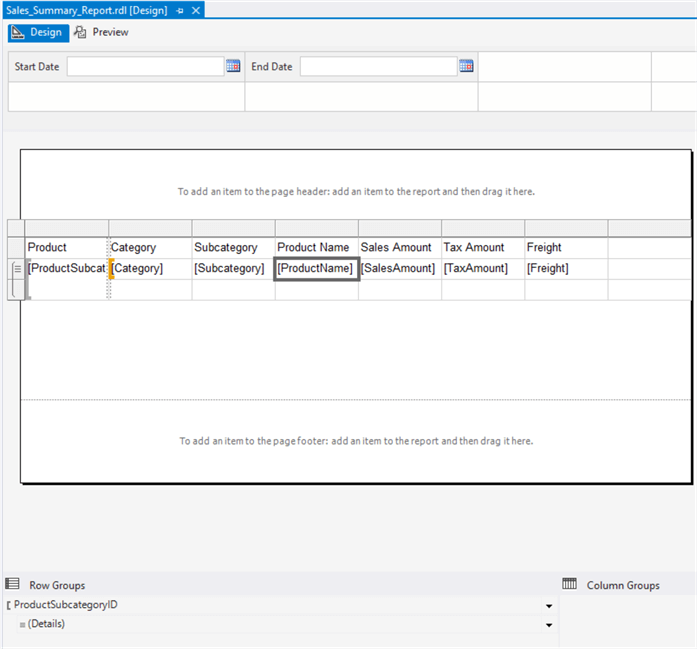
Figure 32 Group Rows by the Product Subcategory
When we select an empty cell at the group footer, the orange bracket (shown in Figure 33) appears on the left of the "ProductSubcategoryID" cell, which indicates this cell is at the first grouping level.
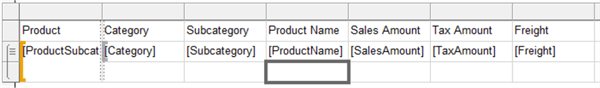
Figure 33 Check the Grouping Level of a Cell at the Group Footer
To show a group summary at the end of each group, we add fields into the group footer. The group footer automatically sums numerical values. The report body should look like Figure 34.
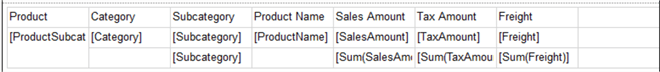
Figure 34 Add Group Summary to the Group Footer
We repeat adding a group level procedure to add the product category group, which is the parent group of the product subcategory. The report body should look like Figure 35.
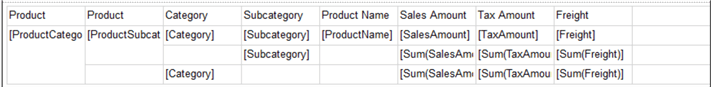
Figure 35 The Report with Two Grouping Levels
Switch to the "Preview" tab to preview the report with two grouping levels. The report should look like Figure 36. When we add two grouping levels, the designer automatically inserts two columns. We may not use column spans in a report, especially when a column spans multiple pages. To keep the report simple, we delete the auto-generated columns.
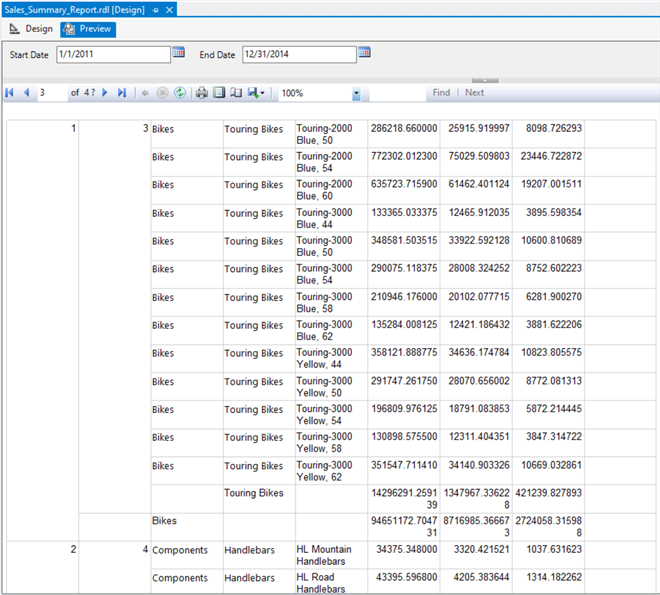
Figure 36 Preview the Report with Two grouping Levels
Right-clicking on the first column, the context menu appears, as shown in Figure 37. Select the "Delete Columns" item. This action deletes the selected column, but it does not delete the group.
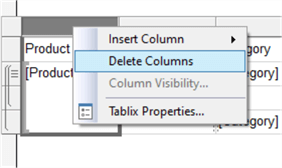
Figure 37 Delete Columns
We repeat the delete columns steps to delete the second auto-generated column. The report body should look like Figure 38.
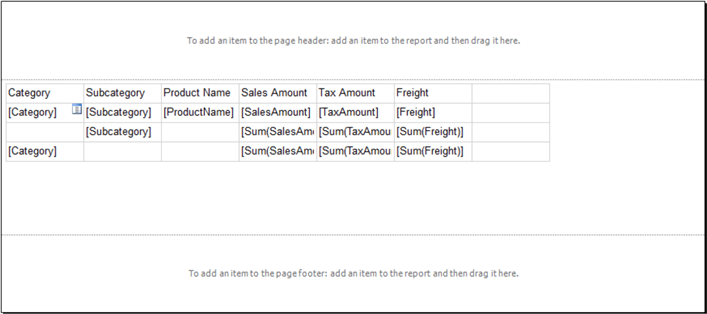
Figure 38 The Layout of the Report
2.3.4 Append a Row with Grand Totals to the Table
We want to add grand totals to the report. Click on the down arrow in the "Row Groups" panel. The context menu should look like Figure 39.
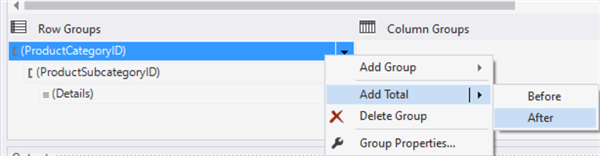
Figure 39 Add a Grand Total Row to the Table
Select "Add Total > After" from the context menu. A new row appends to the table, and the table should look like Figure 40.
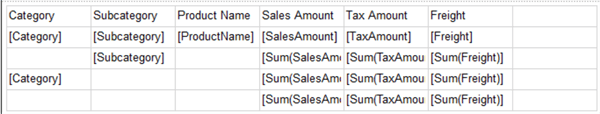
Figure 40 The Table with the Grand Total Row
2.3.5 Compute the Extended Sales Amount
The extended sales amount is the sum of sales amount, tax amount, and freight. Several methods are available to perform the calculation. We use SSRS expression [8].
Right-click on the empty cell in the first row. The context menu should look like Figure 41. Click on the "Expression" menu item.
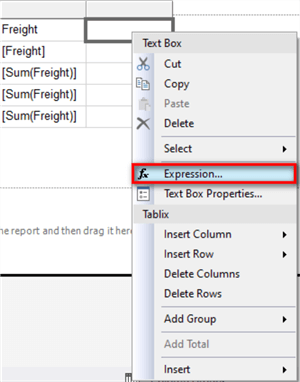
Figure 41 Add SSRS Expression to a Cell
The Expression dialog appears, and we enter the column title "Extended Amount" in the text box. The expression dialog should look like Figure 42.
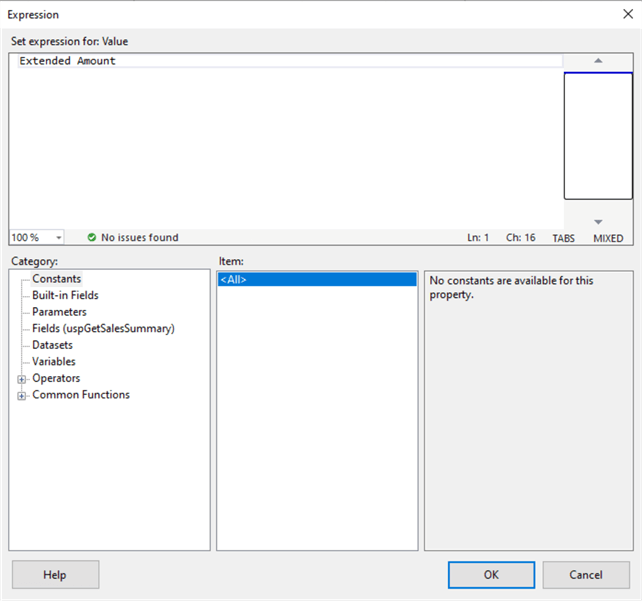
Figure 42 Set Expression for the Cell
Click on the "OK" button to close the dialog. The added column title appears in the table, as shown in Figure 43.
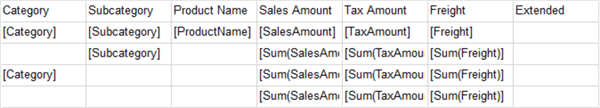
Figure 43 Add Column Title to the Table
We use the same method to add expression to the second cell in the last column. Instead of using a string as the expression, we enter the following expression in the "Expression" dialog:
=Fields!SalesAmount.Value + Fields!TaxAmount.Value + Fields!Freight.Value
Enter the following expression to the rest empty cells in the last column:
=sum(Fields!SalesAmount.Value + Fields!TaxAmount.Value + Fields!Freight.Value)
Switch to the "Preview" tab. The report should look like Figure 44. We can pick a different date range and then click on the "View Report" button to review data in a different period. We can also navigate to different groups.
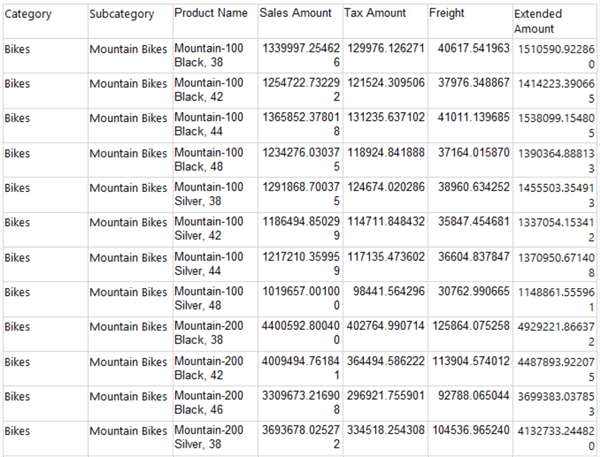
Figure 44 The Report with a Computed Column
2.3.6 Decorate the Table
Switch to the "Design" tab. Click any area inside the table. Two grey bars appear to the left and top of the table, respectively. Click on the left grey bar to select the table header, as shown in Figure 45.
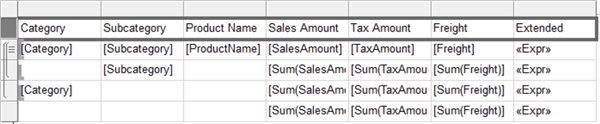
Figure 45 Select the Table Header
With the table header selected, the "Properties" panel shows the row properties. Make the changes in the "Properties" panel based on Table 2.
| Property | New Value |
|---|---|
| BorderColor: Default | Black |
| BorderColor: Bottom | DarkSlateBlue |
| BorderStyle: Default | None |
| BorderStyle: Bottom | Solid |
| Color | DarkSlateBlue |
| Font: FontSize | 9pt |
| Font: FontWeight | Bold |
Table 2 Change the table header properties
Select the data row at the detail level, i.e., the second row. Make the changes in the Properties panel according to Table 3.
| Property | New Value |
|---|---|
| BorderColor: Default | Black |
| BorderStyle: Default | None |
| Font: FontSize | 9pt |
Table 3 Change the data row properties
The other three rows are group footers and the table footer. The column of the product name does not have value in these footers; we merge this cell to its adjacent cells. Select two cells, as shown in Figure 46 and right-click to bring up a context menu.
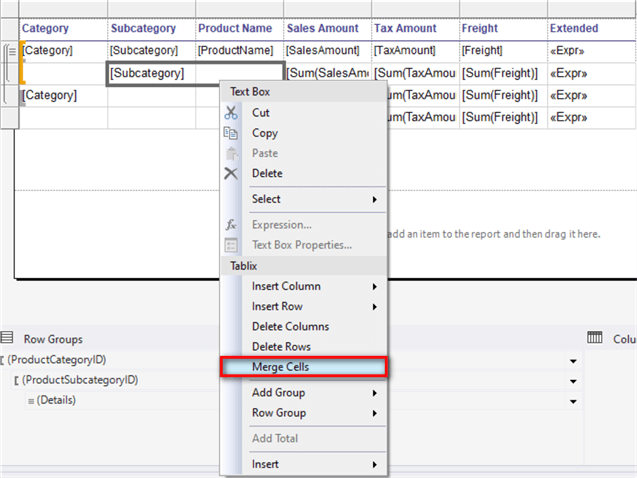
Figure 46 The Context Menu for Merging Cells
Click on the menu item "Merge Cells" to merge these two cells. We use the same method to merge the first three cells in the fourth row and fifth row. We also add some text to explain the row. The table should look like Figure 47.
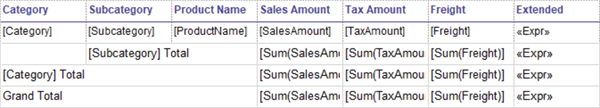
Figure 47 The Report Body with Merged Cells
Holding the "Ctrl" key, we can use the mouse to select the last three rows, i.e., footer rows. Then, go to the "Properties" panel. We change the properties of these three selected rows based on Table 4.
| Property | New Value |
|---|---|
| BorderColor: Top | DarkSlateBlue |
| BorderStyle: Default | None |
| BorderStyle: Top | Solid |
| BorderStyle: Bottom | Solid |
| Font: FontSize | 9pt |
| Font: FontWeight | Bold |
Table 4 Change the Footer Row Properties
The size of the contained items determines the column width and row height. Thereby, we usually set the minimum height and width of the cell by assigning values to its contained item’s height and width.
In practice, we can move the boundary of a cell to change the size of the cell. As a quick demonstration, we adjust each column’s width in the report table based on Table 5. Since each cell contains text, it is tricky to select the contained item in a cell. When we move the mouse over a text in the cell, we select the text by clicking on the text. When we move the mouse over an empty area in the cell and click on the empty area, we select the textbox. The name in the "Properties" panel can tell which item we select.
| Column No | Column Header | Size | Text Alignment |
|---|---|---|---|
| 1 | Category | 0.90in, 0.19in | Center (Header Only) |
| 2 | Subcategory | 1.20in, 0.19in | Center (Header Only) |
| 3 | Product Name | 1.90in, 0.19in | Center (Header Only) |
| 4 | Sales Amount | 0.95in, 0.19in | Right |
| 5 | Tax Amount | 0.90in, 0.19in | Right |
| 6 | Freight | 0.86in, 0.19in | Right |
| 7 | Extended Amount | 1.18in, 0.19in | Right |
Table 5 Column Header, Width and Text Alignment
After setting properties for the table header, we set the height of the detail row. Select the textbox in the first cell and set the height of the textbox 0.18in. Then we select first the textboxes in every footer row and set the height of each textbox 0.19in. Click on an empty area in the report body, and the report body is selected. Change the width of the body to "7.96in", as illustrated in Figure 14. The report table should look like Figure 48.
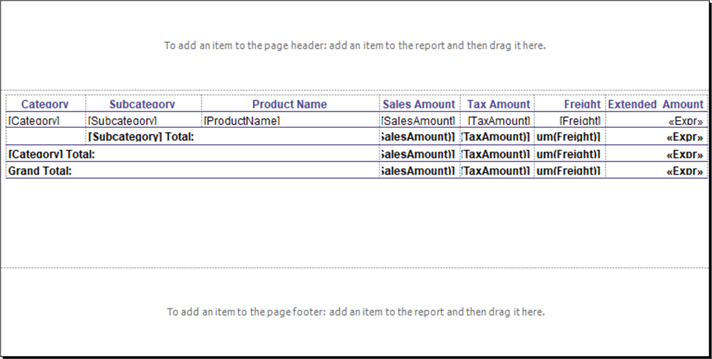
Figure 48 The Report Table Layout
2.4 Format Numbers on the Report
Business users require two decimal places for any dollar amount. We right-click on an empty area in the textbox "SalesAmount" in the second row to bring up a context menu. Select "Textbox Properties…" from the context menu. The "Text Box Properties" dialog appears. Set the textbox properties, as shown in Figure 49. Business users determine to use either numeric format or currency format.
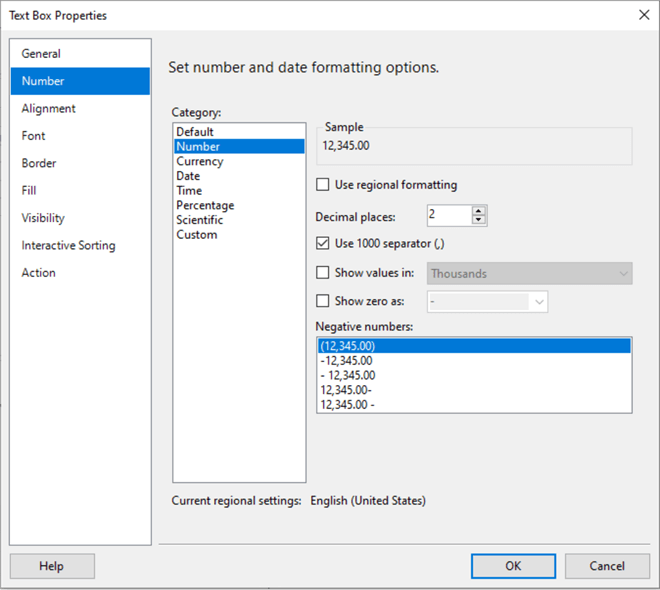
Figure 49 Set Number Formatting in the Text Box Properties Dialog
Click the "OK" button to close the dialog. The format property of this textbox in "Properties" panel is automatically set to "#,0.00;(#,0.00)", as shown in Figure 50. Thus, we update the "Format" property of other numeric textboxes by using this value.
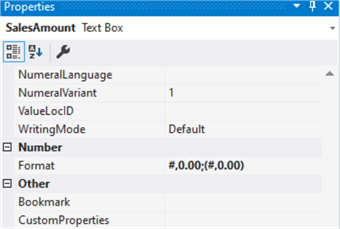
Figure 50 Set Formatting through the Properties Panel
Then, switch to the "Preview" tab and navigate to the last page of this report. The last page should look like Figure 51. We observe that the last page does not have column headers.
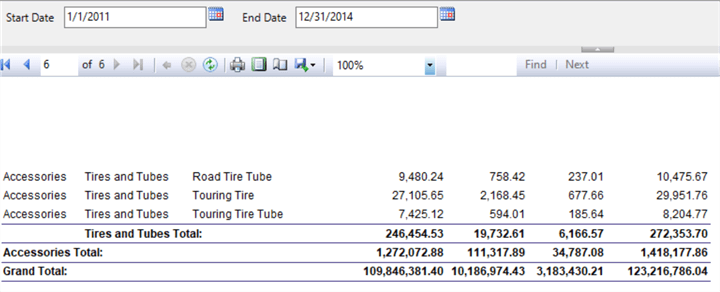
Figure 51 The Last Page of the Report
2.5 Repeat Column Headers on Every Page
We already set the table property "RepeatColumnHeader" to "True," as shown in Table 1. Figure 51 indicates that the table header did not repeat on the last page. It seems the SSRS does not recognize the column headers. To make the column headers repeat on every page, we need to use the "Advanced Model" in the grouping panel. Click on the down arrow shown in Figure 52. Select the "Advanced Mode" item from the context menu.
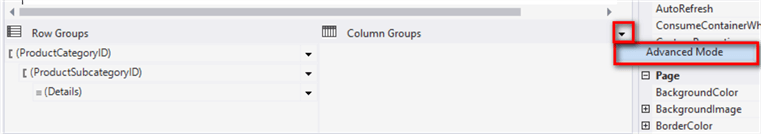
Figure 52 Switch to the Advanced Mode
In the "Advanced Mode" panel, click on the first "Static" in the "Row Groups" panel, as shown in Figure 53. In the "Properties" panel, change the property "RepeatOnNewPage" to "True." We also need to select the option "After" as a value of the property "KeepWithGroup."
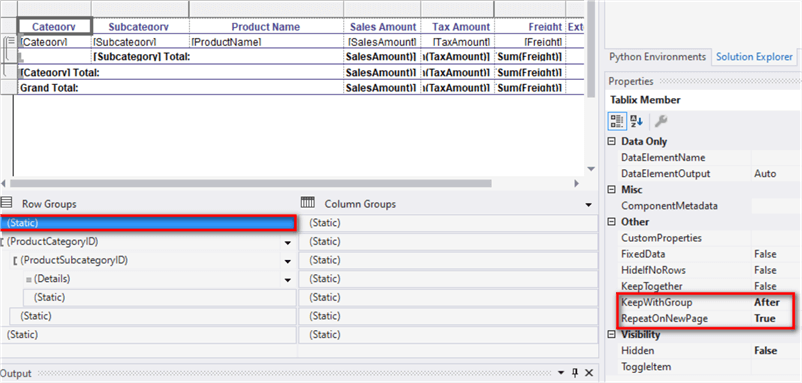
Figure 53 Repeat Column Header on Every Page
Then, switch to the "Preview" tab and go to the last page of the report. The last page should have column headers, as shown in Figure 54.
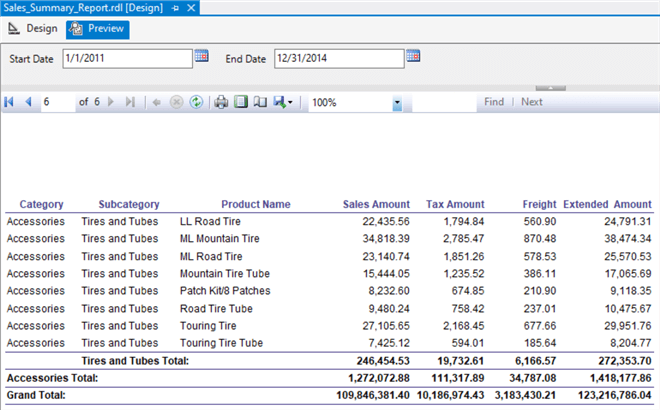
Figure 54 The Last Page with Column Headers
2.6 Apply Colors to Alternate Rows
To apply colors to alternate rows, we use an expression to determine the background color dynamically. Select the detail row in the table, and drill down into the "BackgroundColor" property in the "Properties" panel, as shown in Figure 55.
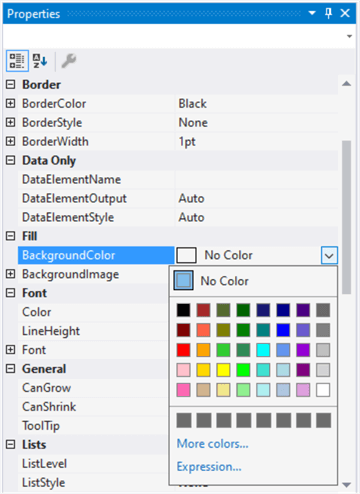
Figure 55 Set the Background Color of the Detail Row
Select "Expression" item from the pull-down menu. The "Expression" dialog appears. We enter the following expression in the dialog:
The value of "tbl_Sales_Summary" is the table name that we set according to Table 1. The "Expression" dialog should look like Figure 56.
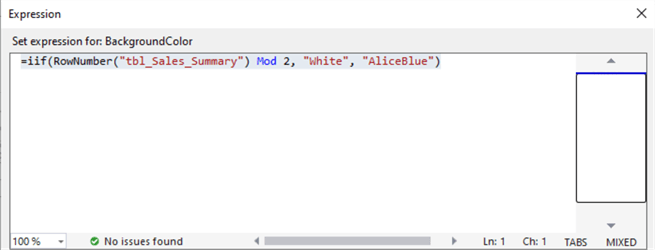
Figure 56 Enter an Expression to Determine the Background Color of a Detail Row
Switch to the "Preview" tab and navigate to the last page. The report looks like Figure 57.
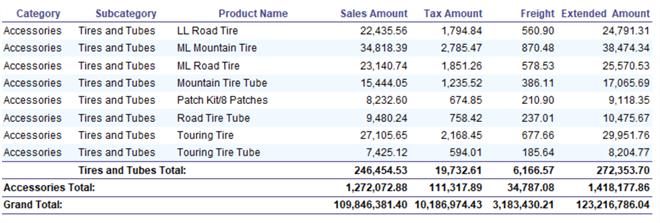
Figure 57 Apply Colors to Alternate Rows
2.7 Add a Report Header and Footer
We repeat a header and footer on every page. The report header often includes information such as title, subtitle, and company logo. Some items, such as the date of generation and the page number, are in the footer section. We sometimes draw a line above or below the header or footer.
Since the table can automatically expand vertically, we move the footer section close to the table. Then, we drag three textbox items to the header section and drag two textbox items to the footer section. We set the properties of these textboxes according to Table 6. We can set font properties through either the "Properties" panel or the toolbar on the top.
| Textbox No | Size | Text | Font | Expression |
|---|---|---|---|---|
| 1 | 4in,0.22in | Adventure Works Cycles Sales Department | FontFamily: Arial FontSize: 9pt | |
| 2 | 4in,0.22in | Sales Summary Report | FontFamily: Arial FontSize: 10pt FontWeight: Bold | |
| 3 | 4in,0.16in | From to (drag the parameters to the textbox) | FontFamily: Arial FontSize: 8pt | =Parameters!StartDate.Value =Parameters!EndDate.Value |
| 4 | 4in,0.16in | Generated at | FontFamily: Arial FontSize: 8pt Color: LightGrey | =Globals!ExecutionTime |
| 5 | 1.0in,0.16in | FontFamily: Arial FontSize: 8pt Color: LightGrey | ="Page " & CStr(Globals!PageNumber) & " of " & CStr(Globals!OverallTotalPages) |
Table 6 Configure Textboxes Properties
To precisely position these textboxes in the header and footer sections, we can use Ctrl + arrow keys to move a textbox when the textbox is selected. The report should look like Figure 58.
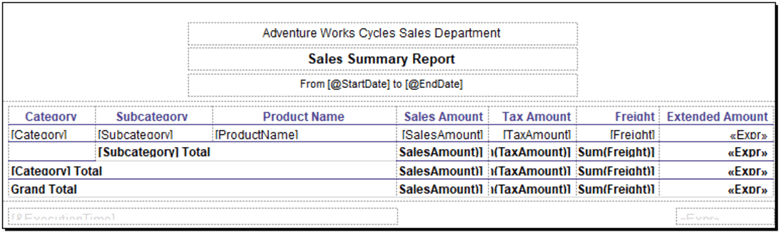
Figure 58 Add a Header and a Footer to the Report
3 – Add Configurable Settings to the Report
In the SQL Server 2016 release, the SSRS provides a new web portal, which is a web-based application, for report managers to configure reports. We should draw a dividing line between the report development and report management. When we complete the development, the control of the reports passes to report managers. The report managers should be able to modify the reports. For instance, the report manager can modify text in the header section without any development effort.
3.1 Create Parameters
Right-click on the "Parameters" folder in the "Report Data" panel. Select "Add Parameter…" menu item in the context menu. The "Report Parameter Properties" dialog shows up, and we fill-up the form according to Figure 59. We hide the parameter so that the report does not ask input from report users. The report managers can change the default value of the parameter through the web portal.
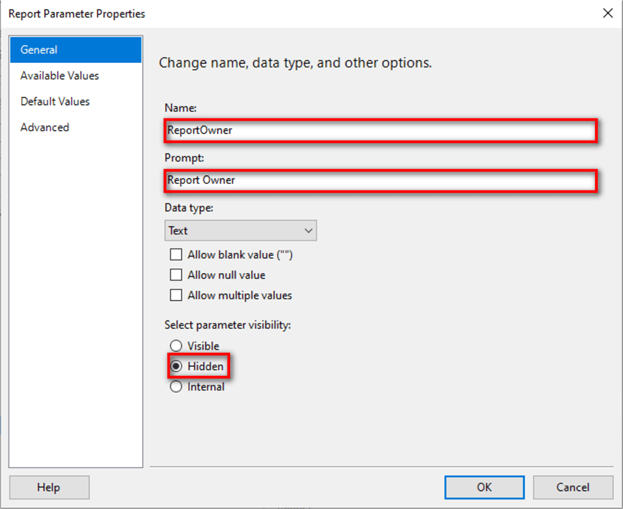
Figure 59 Create a New Parameter of the Report Owner
Switch to the "Default Values" tab. Select the "Specify values" option and click the "Add" button to add a default value "Adventure Works Cycles Sales Department," as shown in Figure 60.
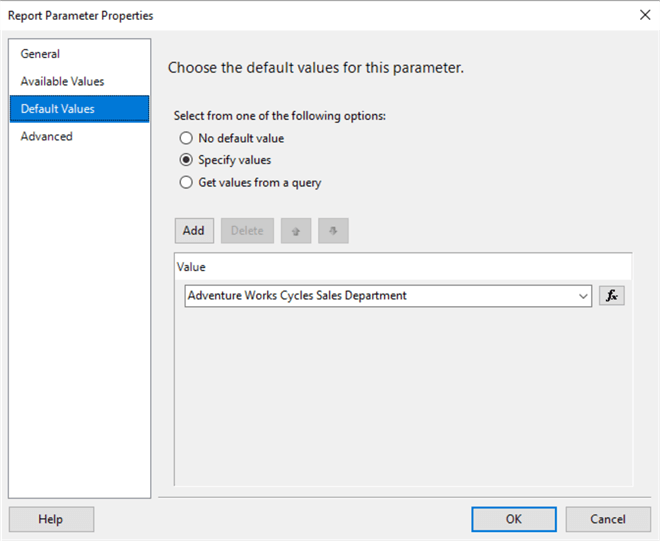
Figure 60 Specify a Default Value for the Parameter
Click the "OK" button to close the dialog. Then drag the new parameter "report_owner" to the first textbox in the header section and delete the other words in the box. The report header should look like Figure 61.
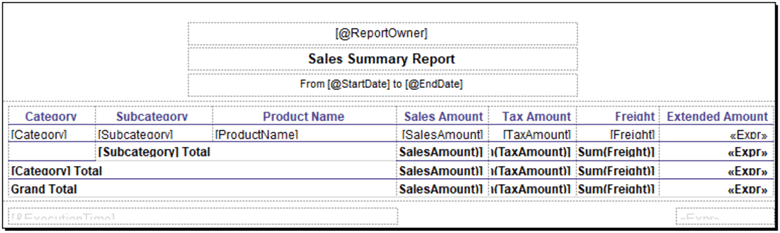
Figure 61 Parametrized Report Header Section
3.2 Use Report Metadata
The second textbox in the report header section contains the report name. Since report managers can change the report name through the web portal, we should use the built-in field "ReportName." Right-click on the second textbox. The pop-up context menu should look like Figure 62.
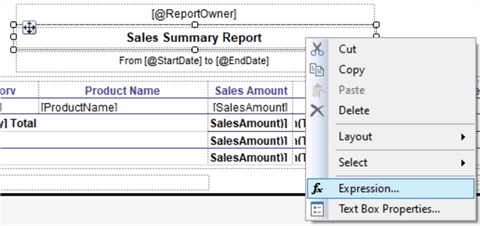
Figure 62 Use an Expression to Replace the Static Text
Select "Expression…" item from the context menu. The "Expression" dialog appears. We enter the following expression in the text box:
=Globals!ReportName
Click on the "OK" button to close the dialog. The design view of the report should look like Figure 63.
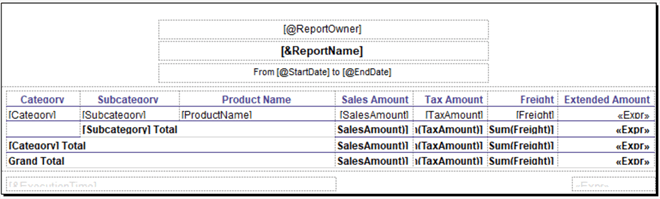
Figure 63 The Design View of the Report
4 – Add External Images to the Report
The report designer provides three options to reference images; the three options are "Embedded," "External," and "Database." The "Embedded" option can always ensure images are available to the report, but images cannot be shared [9]. Besides, report managers cannot replace images through the web portal. If images are part of data, such as product images, it will be preferable to use the "Database" option. For static images, such as a company logo, we should use the "External" option. By using the "External" option, we store images on the report server or a web server. In this exercise, we store a company logo on the report server.
4.1 Upload an Image to the Report Server
Access the web portal through the web portal URL such as "http://<servername>:80/reports". As shown in Figure 64, select the "Folder" item from the "New" pull-down menu. In the pop-up window, enter "IMAGE" as the new folder name and click on the "Create" button to create the new folder. Then, use the "Upload" menu button to upload the logo of mssqltips.com to the IMAGE folder.
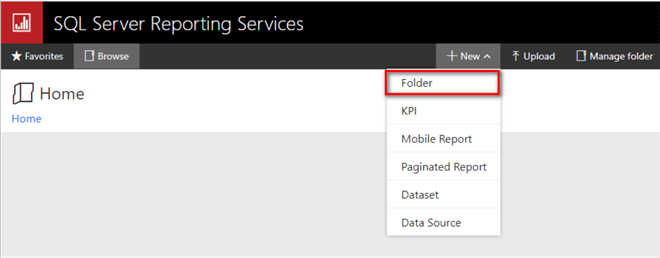
Figure 64 Home page of the Reporting Services web portal
Access the IMAGE folder on the web portal. The "IMAGE" folder page should look like Figure 67. Copy the logo image file into a local folder "C:\temp\."
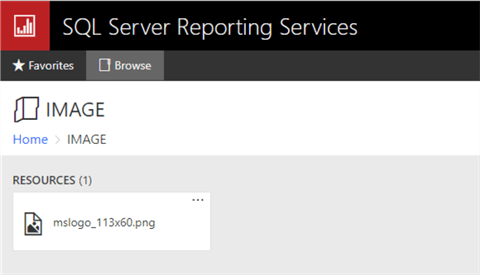
Figure 67 Upload the logo to the IMAGE folder
4.2 Configure the Unattended Execution Account
The SSRS provides a special account, the unattended execution account, to retrieve external image files. To configure the account, we first need to create or select a domain account, which should have reduced permission [10].
4.2.1 Specify the Unattended Execution Account
Run the "Report Server Configure Manager" from the start-up menu, and switch to the "Execution Account" panel. As shown in Figure 66, the description on the right panel introduces the special account. Select the "Specify an execution account" checkbox. Then, enter the account name and password. Click the "Apply" button to apply the changes.
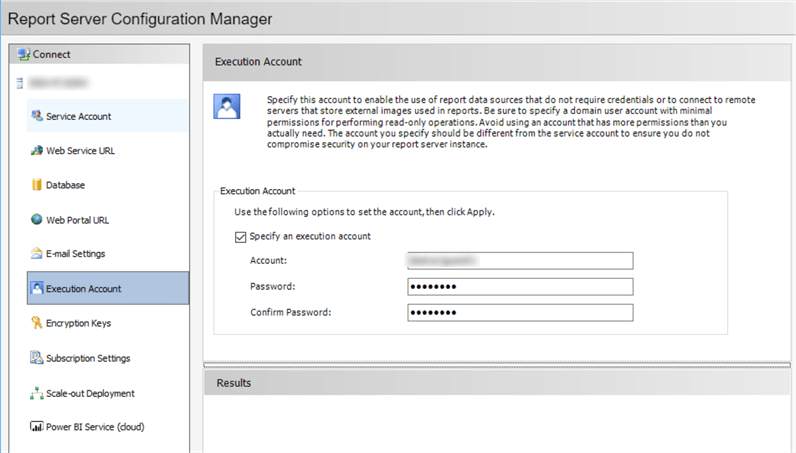
Figure 66 Configure the Unattended Execution Account
4.2.2 Configure a Folder Security
Access the web portal and click the "…" on the IMAGE folder’s top-right corner. Select the "Manage" menu item from the pop-up menu. The browser reaches the "Home > IMAGE > Manage > Properties" page. Click the "Security" link button on the right panel and access the "Security" page, as shown in Figure 69.
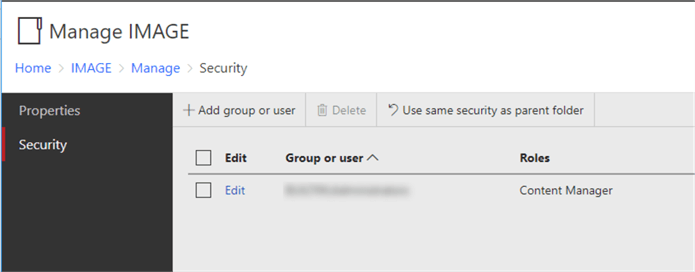
Figure 69 The Security Page of the IMAGE Folder
Click on the "Add group or user" link button, assign the unattended execution account to the "Browser" role, as shown in Figure 70.
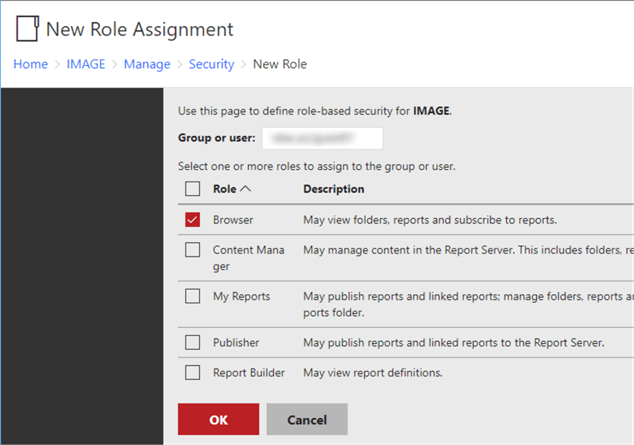
Figure 70 Give the Unattended Execution Account a Permission to Browser the Folder
Click on the "OK" button. The "Security" page should look like Figure 71.
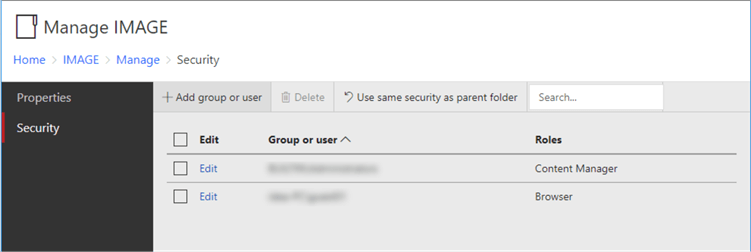
Figure 71 Security Page of the IMAGE Folder
4.3 Add the Image to the Header Section
Drag an Image item from the toolbox to the report header section. The "Image Properties" dialog appears. We name the image as "complayLogo" and choose the "External" as the image source. The dialog should look like Figure 72.
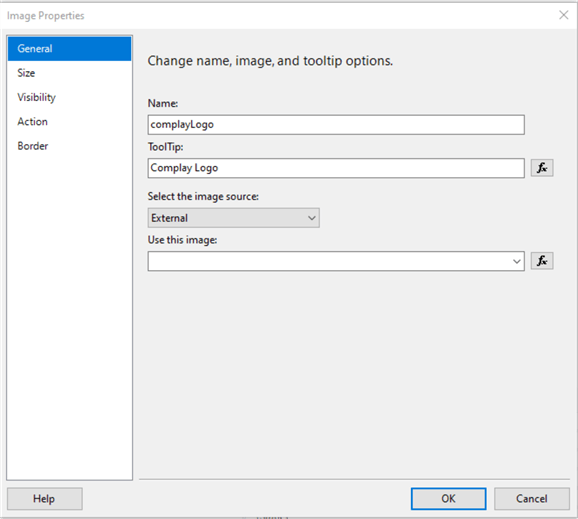
Figure 72 Set Image Properties
Click on the "fx" button beside the "Use this image" box, enter the following code in the "Set expression for: Value" box in the "Expression" dialog:
=IIF(Globals!ReportServerUrl is Nothing,
"file:C:\temp\mslogo_113x60.png",
Globals!ReportServerUrl + "?/IMAGE/mslogo_113x60.png")
The expression indicates that the report uses the image file in the local computer when we view the report on the "Preview" tab, and the report uses the image through http:// <servername>/reportserver?/IMAGE/mslogo_113x60.png when we view the report from the report server. Click on the "OK" button to close the dialog. Click the "OK" button to close the "Image Properties" dialog.
Move the Image item to the desired location, as shown in Figure 71. Sometimes, we need to go back to the "Image Properties" dialog to set up the image size.
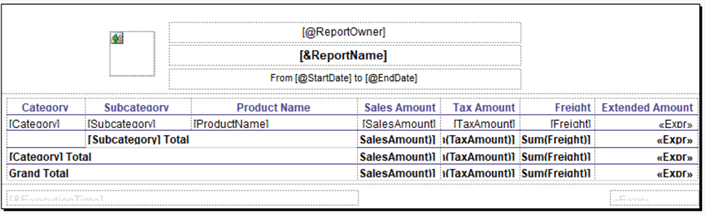
Figure 71 Place a logo into the report header section
4.4 Access the Report through the Web Portal
The Reporting Services web portal allows us to publish our reports. Through the Internet, report users can access these reports. The web portal includes security configurations to folders and reports. We can also use the web portal to administer a single report server instance [11].
4.4.1 Deploy the Report to the Report Server through Visual Studio
Right-click on the report project in the "Solution Explorer" panel. Select the "Deploy" item from the context menu, as shown in Figure 72.
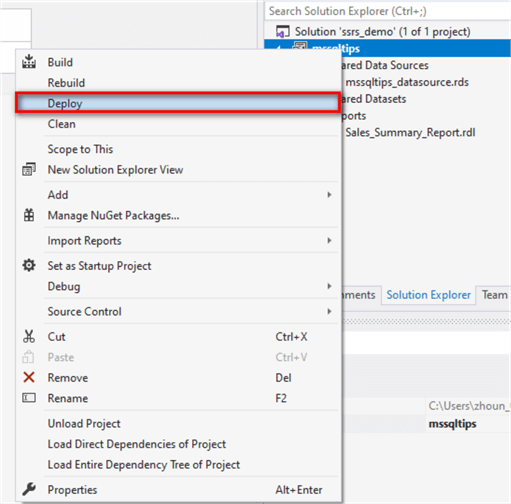
Figure 72 Deploy the Report Project through Visual Studio 2019
4.4.2 Access the Report through the Web Portal
Access the web portal, and the report is in the folder "mssqltips_reports." Then, we open the folder and double click on the report to launch the report. In the report page, we select a data range from 2011-06-01 to 2011-06-10. The report should look like Figure 73. We observe that the report name includes some hyphens.
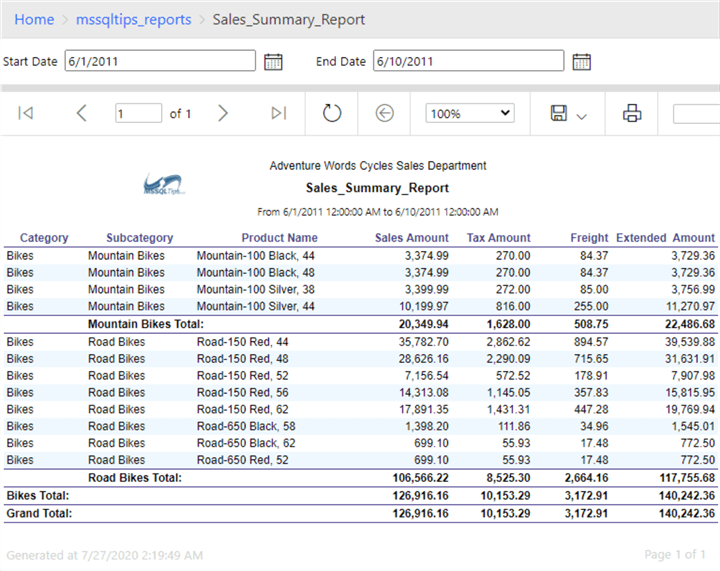
Figure 73 Access the Report on the Report Server
4.4.3 Modify the Report Header Through the Web Portal
Since some objects in the report header are configurable, report managers can use the web portal to modify these objects.
Access the page "Home > mssqltips_reports > Sales_Summary_Report > Manage > Properties" through the Web Portal. Click on the "Properties" link on the left panel. Change the report name to "Sales Summary Report," as shown in Figure 74. Click the "Apply" button.
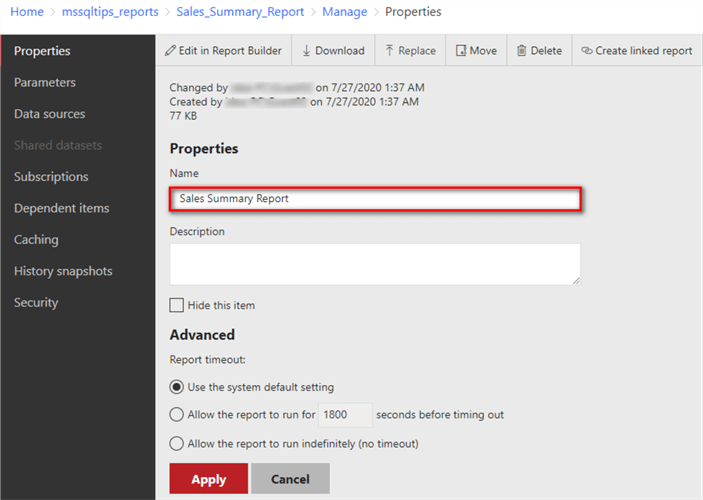
Figure 74 Change the Report Name
Selecting the data range between 2011-06-01 and 2011-06-10, we obtain a report that should look like Figure 1, in which the updated title is in the header section. We can also change other objects on the header section through the web portal [1].
Summary
In this tip, we walked through a process to create a ready-to-use report. We added a shared data source and an embedded dataset to the report. The report used the table data region to group sales summary data into multiple grouping levels. We also demonstrated a trick to show the table header on every page. To enable report managers to customize the report, we created a hidden parameter with a default value, and the report used this value to decorate the header section. We replaced the report name in the header section with the built-in field. We presented an approach to add an external image to the report. Finally, we explored a method to access the report through the web portal.
Reference
[1] Zhou, N. (2018). Creating a Detailed SQL Server Reporting Services Report Containing External Images and Repeated Table Header. Retrieved from mssqltips: https://www.mssqltips.com/sqlservertip/5800/creating-a-detailed-sql-server-reporting-services-report-containing-external-images-and-repeated-table-header/.
[2] Kess, B. (2017). AdventureWorks sample databases. Retrieved from Github: https://github.com/Microsoft/sql-server-samples/releases/tag/adventureworks.
[3] Kellenberger, K. (2016). Beginning SQL Server Reporting Services. Edwardsville, Il: Apress.
[4] Sparkman, M. (2020). Data Sources Supported by Reporting Services (SSRS). Retrieved from Microsoft: https://docs.microsoft.com/en-us/sql/reporting-services/report-data/data-sources-supported-by-reporting-services-ssrs?view=sql-server-ver15.
[5] Jin, Y. S., Wenzel, M., Latham, L., Hoffman, M., Jones, M., Blome, M. & Guyer, C. (2017, March 29). Managing Permissions with Stored Procedures in SQL Server. Retrieved from Microsoft: https://docs.microsoft.com/en-us/dotnet/framework/data/adonet/sql/managing-permissions-with-stored-procedures-in-sql-server.
[6], Inmon, H. W. (2005). Building the Data Warehouse (4th Edition). Indianapolis, IN: John Wiley & Sons
[7] Sparkman, M., Milener, G., Howell, W. J., Guyer, C. & Rabeler, C. (2017, March 13). Tables, Matrices, and Lists (Report Builder and SSRS). Retrieved from SQL Docs: https://docs.microsoft.com/en-us/sql/reporting-services/report-design/tables-matrices-and-lists-report-builder-and-ssrs?view=sql-server-ver15.
[8] Hamilton, B., Sparkman, M., Milener, G., Howell, W. J., Guyer, C. & Rabeler, C. (2017, March 13). Expression Uses in Reports (Report Builder and SSRS). Retrieved from SQL Docs: https://docs.microsoft.com/en-us/sql/reporting-services/report-design/expression-uses-in-reports-report-builder-and-ssrs?view=sql-server-ver15.
[9] Sparkman, M., Milener, G., Howell, W. J., Guyer, C. & Rabeler, C. (2017, February 28). Images (Report Builder and SSRS). Retrieved from SQL Docs: https://docs.microsoft.com/en-us/sql/reporting-services/report-design/images-report-builder-and-ssrs?view=sql-server-ver15.
[10] Ghanayem, M., Milener, G., Howell, W. J., Guyer, C. & Sparkman, M. (2017, May 30). Configure the Unattended Execution Account (SSRS Configuration Manager). Retrieved from SQL Docs: https://docs.microsoft.com/en-us/sql/reporting-services/install-windows/configure-the-unattended-execution-account-ssrs-configuration-manager?view=sql-server-ver15.
[11] Ghanayem, M., Milener, G., Howell, W. J., Guyer, C. & Sparkman, M. (2017, May 30). The web portal of a report server (SSRS Native Mode). Retrieved from SQL Docs: https://docs.microsoft.com/en-us/sql/reporting-services/web-portal-ssrs-native-mode?view=sql-server-ver15.
Next Steps
- This tip placed focus on creating a ready-to-use report at work. Many tasks in this tip have alternative solutions. We chose straightforward solutions to move forward in building the report. However, these solutions may not best fit all situations. If we do not have much background in report development, we follow this tutorial to create a report. Then, we play with other features provided by SSRS to make the report work better. If an organization starts to use SSRS reports, report developers should work with report users to compile some reporting conventions such as report layout, font size, and text alignment. These conventions help to maintain consistency in the organization.
- Check out these related tips:
- What's New for SQL Server Reporting Services 2016 Q&A
- Installing SQL Server Reporting Services 2017
- SQL Server Reporting Services 2017 Setup
- SQL Server Reporting Services (SSRS) Repeating Headers on Pages
- SQL Server Reporting Services Image Source Report Options
- Rendering images from a database on SSRS reports
- SQL Server Reporting Services Custom Code Assemblies
- Alternate Row Background Color in SQL Server Reporting Services Tablix and Matrix
- SQL Server Reporting Services Formatting and Placeholders
- SQL Server Reporting Services: What I wish I knew when I started?
- Conditional Formatting for SQL Server Reporting Services Reports


About the author
 Nai Biao Zhou is a Senior Software Developer with 20+ years of experience in software development, specializing in Data Warehousing, Business Intelligence, Data Mining and solution architecture design.
This author pledges the content of this article is based on professional experience and not AI generated.
View all my tips
