Problem
The need for real time analytics, advanced analytics, and reporting within the Lakehouse is a growing demand for many organizations. Databricks is a robust unified data and data analytics platform that offers numerous capabilities for reporting and analytics. Customers are interested in learning more about these features and benefits of real time analytics, advanced analytics and reporting for Databricks.
Solution
Databricks provides a number of real-time, advanced analytics, reporting capabilities as a cloud platform that you will learn more about in this article. We’ll begin by discussing the various features for real-time analytics including Spark Structured Streaming, Change Data Feed, Auto Loader and Delta Live Tables. After that you will learn about advanced analytics features such as the end-to-end Machine Learning workspace, along with its features and capabilities for serving and managing ML Models. Finally, you will learn more about how Databricks integrates with Power BI for low latency, high performance reporting \ business intelligence dashboards, models, and visuals.
Real-time Analytics
Apache Spark Structured Streaming service built on the Spark SQL engine which will run queries incrementally and continuously append incoming data as it becomes available directly from your IoT devices, sensors, social networks, cloud data and online transactions. It integrates well with both IoT and Event Hubs and supports a variety of data output modes including append (only add new records to the output sink), update (update changed records in place), and complete (rewrite the full output) modes. The figure below shows the architectural pattern that Structured Streaming typically supports within Databricks.

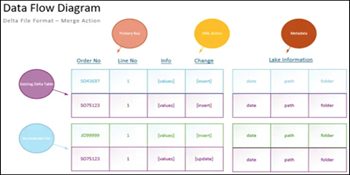
Real time Change Data Capture has been a key requirement for numerous ETL \ ELT and data warehouse processes. The same is true for the Lakehouse platform, and Databricks simplifies this process with its Change Data Feed service which enables you to only read a delta table’s change feed rather than the entire table to capture and manage changes. It requires you to manually enabling a delta table’s change data feed properties. This configuration can be set at either the table for individual tables or cluster level for all tables associated with the cluster and the process will capture and store related meta-data. There are a variety of connectors for other transactional systems such as Microsoft Azure Cosmos DB for integrating the Change Feed Process of data into the Lakehouse which can be processed by Databricks.
Databricks also provides an Auto Loader service which is a designed for event driven structured streaming ELT data pipelines and is constantly evolving and improving with each new runtime release. Auto Loader's cloudFile source supports advanced schema evolution. With schema inference capabilities, there is no longer the need to identify and define a schema. Databricks also offers a service called Delta Live Tables which provides the tools for building and managing reliable real-time pipelines within your Delta Lake. These pipelines can be built on data from cloudfiles sources which are integrated with Auto Loader, Event Hubs, and IoT Hubs to support a process for performing real-time ELT on your data. Delta Live Tables can be created using the syntax shown in in the code below and can be chained to other scripts in the form of dependencies to develop ELT scripts for multiple stages (raw, staging, curated). These pipelines which capture lineage and dependencies can be visually tracked, tested, re-started, and maintained both manually and automatically.
CREATE live TABLE nyc_taxi
COMMENT "Raw Table for nyc_taxi"
AS
SELECT * FROM cloud_files("/data/nyc_taxi", "parquet")
When writing Delta Live Table notebook code, temporary views can also be used as for staging and lookup purposes. Live tables created in previous stages can be used in subsequent stages, with added data quality and integrity checks in the higher staging and curated zones. Table properties, comments, and integrity checks can easily be added through SQL syntax to the Delta Live Tables. After code has been written to create various Delta Live Tables for defining the ELT logic through multiple stages, a new pipeline can be created to orchestrate the process of populating the data in the tables. The figure below shows the UI to create a new pipeline. The notebook where you created your Delta Live Table code will need to be specified. Pipelines can be triggered on a scheduled, or run continuously to incrementally update the tables as new data arrives.

Once the job is set up and run, the figure below shows the full graph that is produced as a result of Databrick’s interpretation of the notebook code since it understands the pipeline’s graph as it relates to semantics, transformations, and infrastructure needs. Clusters will be started and optimized for the Delta Live Table pipelines. The graph shows connections between tables, as well as real-time testing and log updates. These jobs can be scheduled using the scheduler.

Advanced Analytics
From an advanced analytics capability stand point, Databricks supports the full cycle of Machine Learning Model development and serving. With its Machine Learning Workspace, Data Scientists and ML Engineers can create and manage feature development and serving through a feature store, train models through a variety custom and automated experiments, register and track models through a model registry, and serve models through online endpoints. ML Engineers can also create ML Pipelines which can be orchestrated through multi-step jobs.
Within the workspace, you will have access to a variety of libraries, packages, languages and visualizations to support a robust experience for building custom advanced analytics solutions. Databricks Runtime ML clusters include many machine learning libraries, such as TensorFlow, PyTorch, Keras, and XGBoost. Packages such as Maven, CRAN, PyPI, JAR can be imported into notebooks and integrated directly with your code. A variety of visualizations can also be built in the notebook cells to support additional advanced analytics use cases.
Databricks offers a few other features for advanced analytics which include AutoML, MLFlow, and R notebooks. With Auto ML, you will be able to automatically generate machine learning models based on source data and gain deep insights into the results from its included Python notebook with source code for each run, along with summary statistics on the data. MLflow is an open-source platform for managing the end-to-end machine learning lifecycle by tracking experiments to compare and record parameters and results, packaging ML code to share with other Data Scientists or transfer to production, managing and deploying ML models using a variety of available libraries, and registering models for easy model management and serve models to host them as REST endpoints. Finally, with R notebooks in Databricks, you’ll be able to write SparkR for advanced statistics and visualization use cases with seamless access to a variety of R packages.
Reporting
Databricks can be accessed through Power BI by using the built in Power BI connector. This connector supports both Azure Active Directory (AAD) and Single Sign On (SSO). Additionally, the ODBC driver is optimized for highly performant queries. The figure below shows Power BI’s Databricks source configuration UI which requires the Databricks Server Hostname and HTTP Path of the cluster. Optionally, a database can be specified. Notice that both Import and DirectQuery modes are supported. Finally, Fast Evaluation enables faster processing of large DirectQuery and Import based datasets.

Databricks also offers the capability of using their Partner Connect experience within the workspace for connecting to a variety of reporting tools. The figure below shows how Databricks cluster and SQL endpoints can connect to Power BI. Once the compute is selected, simply download the Power BI Desktop extension file(.pbids) and open it.

Once fully authenticated from Power BI based on the connection credentials included in the file, you will be able to access the source data directly from Power BI, as shown in the figure below.

Next Steps
- Read more about Real-time IoT Analytics Using Apache Sparks Structured Streaming (mssqltips.com)
- Read more about Graph Analytics Using Apache Spark GraphFrame API (mssqltips.com)
- Read more about Power BI – Azure Databricks | Microsoft Docs
- Read more about How to Implement a Databricks Delta Change Data Feed Process (mssqltips.com)
- Read more about Auto Loader cloudFiles with Databricks End to End Example (mssqltips.com)

Ron C. L’Esteve is a Data and AI Leader and professional Author residing in Chicago, IL, USA. He is well-known for his impactful books and article publications on Azure Data & AI Architecture, Engineering, and Leadership. Ron holds a Master of Business Administration (M.B.A.) and Master of Science in Corporate Finance (M.S.F.) from Loyola University Chicago. Ron possesses deep technical skills and experience in designing, implementing, leading, and delivering modern Azure Data & AI projects for numerous clients around the world. He is a Motorola Certified Six Sigma Green Belt, a Microsoft Global Challenger, and also holds numerous additional Microsoft, Snowflake, and Databricks professional certifications in Big Data Engineering, Artificial Intelligence, Apache Spark and Data Platform Architecture.
- MSSQLTips Awards: Champion (100+ tips) – 2023 | Author of the Year – 2020-2021 | Rookie of the Year – 2019