Problem
Please demonstrate how to compare with T-SQL time series datasets from two different data providers. The data from a data supplier should provide multiple time series observations (e.g., open and close prices) for multiple ticker symbols (e.g., SPY and QQQ). Describe an approach for detecting and handling bad data. After data are loaded into SQL Server from each data supplier, illustrate how to apply the coefficient of determination for assessing how well the time series from different suppliers correspond to each other.
Solution
MSSQLTips.com recently introduced the basics of how to load time series data into SQL Server from both Yahoo Finance and Stooq.com. The tip showed how to configure csv files with one file per ticker symbol from each source. Each file contained open, high, low, and close prices as well as trading volume on each trading date over a timeframe, such as from the first recorded trading date by a data supplier through the current trading date. When working with securities data, it can be useful to be familiar with multiple data sources. This is because your data needs may extend beyond the longevity of any specific data supplier as well as because different data sources can complement each other.
This tip shows how to load into SQL Server historical time series data for 62 different tickers. The tickers are selected so that they include at least a couple of tickers each for the twelve major security ticker sectors. In addition to the tickers selected for each major sector, other tickers are chosen so you can investigate the price behavior of
- three major US stock market indexes (the DOW, the S&P 500, and the NASDAQ composite)
- regular and inverse indexes for selected security aggregates, such as financial securities, small cap securities, gold miner and natural gas securities)
- selected crypto industry securities
This tip shows how to invoke a stored procedure for computing the coefficient of determination that was described in detail within a prior tip. The coefficient of determination can assess the degree to which two different datasets change their values relative to each other. A simple T-SQL script within this tip illustrates how to invoke the stored procedure to assess the similarity between Yahoo Finance and Stooq.com for several different time series datasets.
Ticker Symbols for this tip
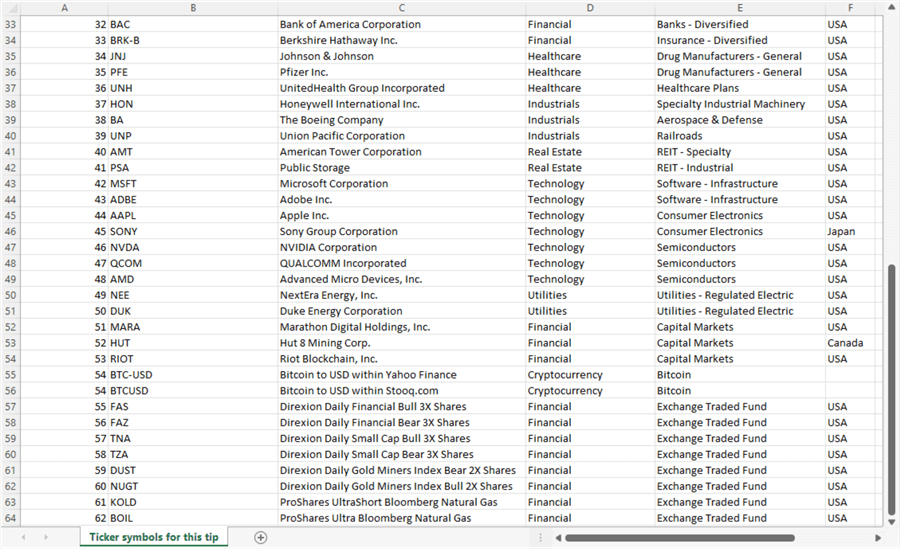
The following two screen shots provide an overview of the 62 ticker symbols for which time series data are available from this tip. The screens are, respectively, for the first and second halves of an Excel worksheet. The worksheet displays a csv file that contains ticker symbols with matching security names, sectors, industries, and home countries. Each row applies to both data sources unless indicated otherwise.
- The Symbol column contains ticker symbols. The first twelve data rows can be viewed as three related sets with four tickers per set.
- The first four rows within the Symbol column have values of SPY, QQQ, DIA, and SOXX. These denote, respectively, exchange traded funds based on the S&P 500 index, the NASDAQ composite index, the DOW index, and a leading index for semiconductor manufacturers.
- The next four rows contain symbol column values of SPXL, TQQQ, UDOW, and SOXL. These are, respectively, for securities whose daily prices are triple levered to the same four indexes. A triple levered security aims to have its price rise or fall three times as much as the underlying security’s daily price change.
- SPXU, SQQQ, SDOW, and SOXS are, respectively, for securities whose daily prices are inversely triple levered for the same four indexes. A triple levered inverse security has its price rise and fall three times as much as in the opposite direction of the underlying index’s daily price change.
- The four symbols with Basic Materials in their Sector column are for companies that manufacture or mine basic materials, such as
- SHW for paints and coatings
- BHP for petroleum, copper, iron ore, and coal
- NEM for gold, copper, silver, and lead
- NUE for steel
- The symbol_number column values correspond to individual ticker symbols (with one exception). The exception is for one security with different ticker symbols from each data supplier. As a consequence, the exception has two rows in the table for the same security.
- Therefore, for 61 tickers, there is just one symbol_number value for each ticker symbol.
- The one exception is for the tickers denoting the value of a single bitcoin unit of cryptocurrency in US dollars.
- Within Yahoo Finance, the exchange rate of a bitcoin in US dollars is represented by BTC-USD
- Within Stooq.com, the same exchange rate is represented by BTCUSD
- As a consequence, the symbol_number value of 54 references the BTC-USD ticker in Yahoo Finance, but the symbol_number value of 54 also represents the BTCUSD ticker in Stooq.com.
- Symbol_number column values (of 51 through 53) point to bitcoin miner firms.
- The ticker symbols for these rows are MARA, HUT, and RIOT
- The country column values indicate that HUT is for a Canadian company, but that MARA and RIOT tickers denote US firms.
- The last eight rows in the worksheet display symbol_number values for pairs of regular and inverse exchange traded funds
- The FAS and FAZ ticker symbols have symbol_number vales of 55 and 56, respectively.
- The FAS ticker seeks to return three times the daily price performance of the Russell 1000 Financial Services Index.
- The FAZ ticker seeks to return the inverse (or opposite) of three times the daily price performance of the Russell 1000 Financial Services Index.
- The TNA and TZA tickers are also inversely related to each other.
- The TNA ticker seeks daily performance that is three times that of the Russell 2000 Index.
- The TZA ticker aims to return the inverse of three times that of the Russell 2000 Index.
- The NUGT and DUST tickers are for indices based on gold miner daily price performance.
- The NUGT ticker is for two times the daily performance of the index.
- The DUST ticker is for the inverse of two times the daily performance of the index.
- The BOIL and KOLD tickers are the last pair of inversely related tickers.
- The BOIL ticker is for two times the daily performance of the Bloomberg Natural Gas Subindex.
- The KOLD ticker is for two times the inverse of the daily performance of the Bloomberg Natural Gas Subindex.
- The FAS and FAZ ticker symbols have symbol_number vales of 55 and 56, respectively.

An overview of the process for transferring time series data to SQL Server
This tip’s solution section references a prior tip with instructions for configuring csv files from both Yahoo Finance and Stooq.com with time series data for ticker symbols. After the csv files are configured and saved, you can attempt to import the data into SQL Server. Presuming there are no rows with missing column values in the csv files, you can easily import the file contents with the bulk insert statement into a SQL Server table.
If this tip’s import code encounters a ticker symbol with rows that have one or more columns with a missing value, the process for transferring time series data into SQL Server fails and halts. The approach used in this tip is to let the error happen, and then manually fix up the source data file. SQL Server error messages for ticker symbols having rows with one or more missing column values can help you navigate to a row for whatever fix up actions you prefer. In this tip, the action is to remove the row with a missing column value.
SQL Server provides built-in features for accommodating rows with missing column values. Depending on the number of missing column values and your inclination to learn the built-in features, you may prefer to use the built-in features, which are described more fully here. On the other hand, you may instead prefer to process the csv files externally in a popular, general purpose scripting language such as Python (here and here). Csv files with missing column values and/or erroneous data are what data scientists typically call messy data. Here is an overview article about five tools for handling messy data.
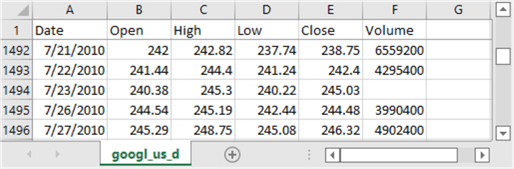
The following screen shot shows an excerpt from the stooq.com historical data download user interface for the GOOGL ticker symbol. The row of data for 23 Jul 2010 has a value of 0 in its volume column. There are no other trading dates with a volume column value of 0 for GOOGL. The value of 0 signifies that Stooq.com does not have any volume of shares traded for the GOOGL ticker symbol on July 23, 2010. In contrast, the time series data for GOOGL on 23 Jul 2010 does have open, high, low, and close prices. This outcome denotes a data error because you cannot have prices for shares traded on a date without at least one share being exchanged between a buyer and a seller. In fact, Yahoo Finance reports about 4.5 million shares being traded on July 23, 2010.

The following screen shot is of the csv file exported by the Stooq.com site. The csv file is displayed via an Excel worksheet. Notice the volume column value is blank for July 23, 2010. The blank value in the csv file is the same as null. Because the bulk insert statement for inserting the csv file into a SQL Server table does not take advantage of SQL Server built-in capability for keeping null values, the code fails with an error message that specifies the line number in the csv file causing the failure.
The information in the error message was used to manually locate the row in the csv file. Then, the row with a null value was deleted from the file. This action and corresponding actions for other ticker symbols are recoded in a txt file for the csv files from Stooq.com and Yahoo Finance. The csv files from each data supplier are stored in a separate path.
- The path for Stooq.com csv files is C:\DataScienceSamples\Stooq_thru_02_22_2022\.
- The path for Yahoo Finance csv files is C:\DataScienceSamples\YahooFinance_thru_02_22_2022\.
After the paths are populated with edited csv files as described above, the processing then transfers the csv files to a SQL Server table – one table for the path with Stooq.com csv files and a second table for the path with Yahoo Finance csv files. The T-SQL script for implementing the transfer for Stooq.com csv files is reviewed in the next section. The download for this tip contains T-SQL scripts for both sets of csv files. In addition, the two T-SQL scripts are slightly different because of data and formatting issues. A few comments in the second subsection of the next section highlights selected code differences for the Yahoo Finance script versus the Stooq.com script.
T-SQL scripts transferring csv files to SQL Server tables
As indicated above, the main focus of this section is to review the code for transferring a folder of csv files from Stooq.com to a SQL Server table. This topic occupies the first and major subsection in this section. The second subsection highlights the differences for the T-SQL script that performs the corresponding roles for the csv files from Yahoo Finance.
Transferring csv files from Stooq.com to a SQL Server table
There are three sections to the T-SQL script.
- The first section specifies a default database for the script (DataScience), creates fresh versions of four tables for transferring the csv files to a permanent table, and populates one of the tables with a set of symbol numbers and ticker symbols for the data supplier, which is Stooq.com in this section. The first section concludes by displaying the symbol numbers and ticker symbols in the csv files from the data supplier.
- The second section runs a while loop across the tickers used in this tip. The loop is passed through 62 times – one pass for each ticker symbol from a data supplier. On each pass through the while loop (except one), the code transfers the time series in one csv file to a SQL Server table. The exception is for the BTCUSD ticker symbol, whose csv file from Stooq.com has a slightly different layout than the csv file for the other ticker symbols.
- The third section contains two select statements.
- The first select statement displays a list of the distinct ticker symbols from the SQL Server table populated with the csv files from a data provider. This display is useful for verifying that the code for performing the transfer of csv files operated for each ticker symbol. Its values can be compared to those from the select statement results set at the end of the first section.
- The second select statement is commented because it does not strictly need to be run. The results set for this select statement contains one row for each date for all the ticker symbols. Because there are literally hundreds of thousands of rows in this table, you would not typically want to display it. However, you can use the table as a source for many analytical studies. A subsequent section in this tip uses excerpts from this table for Stooq.com and Yahoo Finance to assess if the close prices for a select set of symbols have the same trends across the two data suppliers.
The following code excerpt is from the populate_stooq_ohlcv_values_with_symbol_for_feb_2022.sql script file. The main goal of the overall script file is to create and populate the stooq_ohlcv_values_with_symbol table from the csv files for the sixty-two symbols from Stooq.com. The code excerpt below focuses on tables that support the main goal for script file.
- The excerpt begins by specifying with a use statement the DataScience database as the default database. You can change the name to whatever other name you prefer.
- Four drop table if exists statements drop any prior versions of these four tables
- table_of_symbols
- #temp_ohlcv_values
- #temp_ohlcv_values_wo_volume
- stooq_ohlcv_values_with_symbol
- The stooq_ohlcv_values_with_symbol table contains three types of columns. This table contains data for all csv files in a single SQL Server table.
- The symbol column has a value based on the ticker symbol for a specific csv file.
- The date column indicates the dates for which Stooq.com provides time series values.
- The time series values for a ticker symbol include daily trading open, high, low, and close prices as well as the daily trading volume.
- The #temp_ohlcv_values table is a temp table.
- The table is populated for each csv file that the script processes inside its while loop.
- The table has a date column as well as daily open, high, low, and close price columns. The last column in the table contains the volume of shares traded on each trading date for which there is time series data.
- There is no symbol column in this temp table because this table only has columns that are in its source csv file.
- The row values from the #temp_ohlcv_values table along with a symbol column value are inserted into the stooq_ohlcv_values_with_symbol table.
- The #temp_ohlcv_values_wo_volume is a temp table for the csv file for the BTCUSD ticker symbol from Stooq.com.
- This temp table is populated in a short script segment after the while loop because the BTCUSD ticker symbol data requires slightly different processing than for the other ticker symbols.
- This is because the csv file from Stooq.com for the BTCUSD ticker symbol does not contain a volume column.
- Therefore, this table requires a bulk insert statement that sends csv file contents to a table without a volume column, such as the #temp_ohlcv_values_wo_volume.
- The table_of_symbols table contains a symbol number and ticker symbol value for each ticker symbol being processed.
- In this tip, there are 62 rows in the table.
- The symbol_number column facilitates looping through ticker symbols.
- The symbol column contains the ticker symbol value.
- This first section of the script ends by displaying a results set with the full set of ticker symbols being processed. This display serves two purposes.
- First, a user can see the row contents and change them if necessary for any special requirements, such adding more tickers or dropping some tickers.
- Second, the list of ticker symbols from the table_of_symbols table can be compared with the distinct symbols in stooq_ohlcv_values_with_symbol at the end of the script to verify that time series data are loaded for all ticker symbols.
use DataScience
go

drop table if exists dbo.table_of_symbols
drop table if exists #temp_ohlcv_values
drop table if exists #temp_ohlcv_values_wo_volume
drop table if exists dbo.stooq_ohlcv_values_with_symbol


create table #temp_ohlcv_values(
 date date
,[open] money
,high money
,low money
,[close] money
,volume real
)
go

create table #temp_ohlcv_values_wo_volume(
 date date
,[open] money
,high money
,low money
,[close] money
--,volume real
)
go

create table dbo.stooq_ohlcv_values_with_symbol(
 symbol nvarchar(10)
,date date
,[open] money
,high money
,low money
,[close] money
,volume real
)
go


create table table_of_symbols(
 symbol_number int
,symbol nvarchar(10)
)
go

-- populate table_of_symbols
insert into dbo.table_of_symbols
values(1,  'SPY')
      ,(2,  'QQQ')
      ,(3,  'DIA')
      ,(4,  'SOXX')
      ,(5,  'SPXL')
      ,(6,  'TQQQ')
      ,(7,  'UDOW')
      ,(8,  'SOXL')
      ,(9,  'SPXU')
      ,(10, 'SQQQ')
      ,(11, 'SDOW')
      ,(12, 'SOXS')
      ,(13, 'SHW')
      ,(14, 'BHP')
      ,(15, 'NEM')
      ,(16, 'NUE')
      ,(17, 'GOOGL')
      ,(18, 'FB')
      ,(19, 'VZ')
      ,(20, 'DIS')
      ,(21, 'AMZN')
      ,(22, 'TSLA')
      ,(23, 'TM')
      ,(24, 'HD')
      ,(25, 'PG')
      ,(26, 'WMT')
      ,(27, 'KO')
      ,(28, 'XOM')
      ,(29, 'CVX')
      ,(30, 'COP')
      ,(31, 'JPM')
      ,(32, 'BAC')
      ,(33, 'BRK-B')
      ,(34, 'JNJ')
      ,(35, 'PFE')
      ,(36, 'UNH')
      ,(37, 'HON')
      ,(38, 'BA')
      ,(39, 'UNP')
      ,(40, 'AMT')
      ,(41, 'PSA')
      ,(42, 'MSFT')
      ,(43, 'ADBE')
      ,(44, 'AAPL')
      ,(45, 'SONY')
      ,(46, 'NVDA')
      ,(47, 'QCOM')
      ,(48, 'AMD')
      ,(49, 'NEE')
      ,(50, 'DUK')
      ,(51, 'MARA')
      ,(52, 'HUT')
      ,(53, 'RIOT')
      ,(54, 'BTCUSD')
      ,(55, 'FAS')
      ,(56, 'FAZ')
      ,(57, 'TNA')
      ,(58, 'TZA')
      ,(59, 'DUST')
      ,(60, 'NUGT')
      ,(61, 'KOLD')
      ,(62, 'BOIL'


-- display rows in dbo.table_of_symbols
select * from dbo.table_of_symbols order by symbol
The next script excerpt shows the T-SQL code for setting up the operation of the while loop through the ticker symbols and the code for populating the stooq_ohlcv_values_with_symbol for the first three ticker symbols.
- A declare statement declares and assigns local variable values for looping through all the ticker symbols.
- The @symbol_number local variable is initialized to a value of 1.
- The @symbol local variable is initially assigned the symbol column value from the table_of_symbols table with a symbol_number row value of 1.
- The @max_symbol_number is assigned the maximum symbol_number row value from table_of_symbols.
- The while statement starts processing ticker symbols for the symbol with a @symbol_number value of 1 and continues processing ticker symbols through the symbol with a symbol_number of @max_symbol_number.
- A begin statement for a begin…end block appears next. The matching end statement appears at the end of the while loop; the end statement for the begin statement does not show in the excerpt below.
- The begin…end code block is populated by an if statement and a following sequence of else if clauses. The if statement and each else if statement checks to verify if @symbol equals the string value for a ticker symbol. The following code excerpt illustrates the syntax for the first three symbols (SPY, QQQ, DIA) in table_of_symbols.
- The code for each symbol occurs in a begin…end block
- The first statement in the begin…end block is a bulk insert statement to transfer the contents from a csv file whose location is specified by a string value, such as C:\DataScienceSamples\Stooq_thru_02_22_2022\spy_us_d.csv, into #temp_ohlcv_values.
- The second statement is an insert…select statement that populates a block of rows in stooq_ohlcv_values_with_symbol. Each inserted row has a symbol column value equal to @symbol and remaining column values equal to the column values in #temp_ohlcv_values.
- On each pass through the loop, the rows for just one csv file are added to stooq_ohlcv_values_with_symbol.
- On the second and third passes through the loop, the rows of stooq_ohlcv_values_with_symbol are updated to include time series data for QQQ and DIA ticker symbols.
-- declare @symbol for current symbol and related local variables
declare @symbol_number int = 1
      ,@symbol nvarchar(10) =(select symbol from dbo.table_of_symbols where symbol_number = 1)
      ,@max_symbol_number int =(select max(symbol_number) from dbo.table_of_symbols)


-- loop through the rows of the table_of_symbols table
while @symbol_number <= @max_symbol_number
begin

-- import ticker symbol rows from a csv file into #temp_ohlcv_values
-- before inserting the temp table into the stooq_ohlcv_values_with_symbol table
-- use the if and else clauses inside the while loop to control which csv file
-- populates a set of rows on each pass through the loop.
if 'SPY' = @symbol
begin
 bulk insert #temp_ohlcv_values
 from 'C:\DataScienceSamples\Stooq_thru_02_22_2022\spy_us_d.csv'
 with( FORMAT='CSV' , FIRSTROW=2
-- insert #temp_ohlcv_values into stooq_ohlcv_values_with_symbol
-- and populate symbol from @symbol
 insert dbo.stooq_ohlcv_values_with_symbol
 select @symbol symbol, *
 from
(
  select [date]
        ,[open]
        ,[high]
        ,[low]
        ,[close]
        ,[volume]
  from #temp_ohlcv_values
 ) for_stooq_ohlcv_values_with_symbol
end
else if 'QQQ' = @symbol
begin
 bulk insert #temp_ohlcv_values
 from 'C:\DataScienceSamples\Stooq_thru_02_22_2022\qqq_us_d.csv'
 with( FORMAT='CSV' , FIRSTROW=2
-- insert #temp_ohlcv_values into stooq_ohlcv_values_with_symbol
-- and populate symbol from @symbol
 insert dbo.stooq_ohlcv_values_with_symbol
 select @symbol symbol, *
 from
(
  select [date]
        ,[open]
        ,[high]
        ,[low]
        ,[close]
        ,[volume]
  from #temp_ohlcv_values
 ) for_stooq_ohlcv_values_with_symbol
end
else if 'DIA' = @symbol
begin
 bulk insert #temp_ohlcv_values
 from 'C:\DataScienceSamples\Stooq_thru_02_22_2022\dia_us_d.csv'
 with( FORMAT='CSV' , FIRSTROW=2
-- insert #temp_ohlcv_values into stooq_ohlcv_values_with_symbol
-- and populate symbol from @symbol
 insert dbo.stooq_ohlcv_values_with_symbol
 select @symbol symbol, *
 from
(
  select [date]
        ,[open]
        ,[high]
        ,[low]
        ,[close]
        ,[volume]
  from #temp_ohlcv_values
 ) for_stooq_ohlcv_values_with_symbol
end
The final excerpt from the populate_stooq_ohlcv_values_with_symbol_for_feb_2022.sql script file appears next.
- The code starts with an else if clause for the last ticker symbol (BOIL) in table_of_symbols.
- The code for the BOIL ticker symbol follows the same pattern as for the preceding ticker symbols.
- For any given pass through the loop, the value of @symbol will equal just one symbol column value from table_of_symbols.
- After checking if @symbol equals BOIL and optionally migrating rows from a csv file to stooq_ohlcv_values_with_symbol, a truncate table statement clears all rows from #temp_ohlcv_values for processing the next symbol.
- Next, the code updates the values of @symbol_number and @symbol for the next row from table_of_symbols.
- After the updates, an end statement appears that matches the begin statement right after the while statement.
- After the end statement for the while loop, there is code for inserting time series data for the BTCUSD ticker symbol csv file into stooq_ohlcv_values_with_symbol.
- The last uncommented select statement displays a results set for all the distinct symbols in stooq_ohlcv_values_with_symbol. The symbols in the results set should match those from the select statement for table_of_symbols towards the end of the first section from the script.
- A commented select statement can display all the rows in stooq_ohlcv_values_with_symbol.
else if 'BOIL' = @symbol
begin
 bulk insert #temp_ohlcv_values
 from 'C:\DataScienceSamples\Stooq_thru_02_22_2022\boil_us_d.csv'
 with( FORMAT='CSV' , FIRSTROW=2
-- insert #temp_ohlcv_values into stooq_ohlcv_values_with_symbol
-- and populate symbol from @symbol
 insert dbo.stooq_ohlcv_values_with_symbol
 select @symbol symbol, *
 from
(
  select [date]
        ,[open]
        ,[high]
        ,[low]
        ,[close]
        ,[volume]
  from #temp_ohlcv_values
 ) for_stooq_ohlcv_values_with_symbol
end

-- truncate #temp_ohlcv_values
truncate table #temp_ohlcv_values

-- setup for next pass through while loop
set @symbol_number =  @symbol_number + 1
select @symbol =(select symbol
from dbo.table_of_symbols
where symbol_number = @symbol_number)

end

-- special code for BTCUSD symbol without volume values
 bulk insert #temp_ohlcv_values_wo_volume
 from 'C:\DataScienceSamples\Stooq_thru_02_22_2022\btcusd_d.csv'
 with( FORMAT='CSV' , FIRSTROW=2
 insert dbo.stooq_ohlcv_values_with_symbol
( symbol
  ,date
  ,[open]
  ,high
  ,low
  ,[close])
 select 'BTCUSD', *
 from
(
  select [date]
        ,[open]
        ,[high]
        ,[low]
        ,[close]
  from #temp_ohlcv_values_wo_volume
 ) for_stooq_ohlcv_values_with_symbol

---------------------------------------------------------------------------------

-- display distinct symbols in
select distinct symbol from dbo.stooq_ohlcv_values_with_symbol order by symbol

-- optionally display dbo.stooq_ohlcv_values_with_symbol
--select * from dbo.stooq_ohlcv_values_with_symbol order by symbol, date
Transferring csv files from Yahoo Finance to a SQL Server table
The T-SQL code (populate_yahoo_finance_ohlcv_values_with_symbol_for_feb_2022.sql) for transferring csv files to a SQL Server table (yahoo_finance_ohlcv_values_with_symbol) is nearly identical to that for Stooq.com. This tip’s download contains the full listing for the Yahoo Finance T-SQL script file. Here are some key differences between the script files for Yahoo Finance and Stooq.com.
- The ticker symbol for the exchange rate between bitcoin cryptocurrency units and US dollars is
- BTCUSD in Stooq.com
- BTC-USD in Yahoo Finance
- The time series data for the exchange rate between bitcoin cryptocurrency units and US dollars
- does not include daily trading volumes for Stooq.com
- does include daily trading volumes for Yahoo Finance
- Therefore, BTC-USD csv file can be processed like other ticker symbol csv files with the #temp_ohlcv_values table. Recall the BTCUSD csv file requires a special table (#temp_ohlcv_values_wo_volume).
- There are different end-of-line symbols for csv files from Stooq.com and Yahoo Finance.
- The end-of-line symbol for csv files from Stooq.com is a carriage return followed by a linefeed.
- The end-of-line symbol for csv files from Yahoo Finance is just a linefeed.
- As a consequence of this end-of-line symbol difference, the with clause parameter settings for the bulk insert statement must be different for Stooq.com versus Yahoo Finance.
- For Yahoo Finance the settings are: FIELDTERMINATOR = ‘,’, FIRSTROW = 2, ROWTERMINATOR = ‘0x0a’
- For Stooq.com the settings are: FORMAT=’CSV’, FIRSTROW=2
Do prices from Stooq.com and Yahoo Finance vary in the same way?
Up until this point in the tip, we have migrated time series values for prices and volumes for ticker symbols from two different online sources (Stooq.com and Yahoo Finance) to two different SQL Server tables (stooq_ohlcv_values_with_symbol and yahoo_finance_ohlcv_values_with_symbol). For the same ticker symbol, you should expect the price values and volume values from one source to vary in the same way as the prices and volumes from the other source. For example, if you plot Stooq.com close prices by date versus Yahoo Finance close prices by date for a ticker symbol, the scattergram points should fall very close to a line through the points.
The coefficient of determination can assess if this outcome occurs. A prior tip provides a more in-depth explanation of the coefficient of determination statistic along with a stored procedure for computing it. This tip ends with a demonstration of how to compute the coefficient of determination for close prices from yahoo_finance_ohlcv_values_with_symbol versus close prices from stooq_ohlcv_values_with_symbol. When the coefficient of determination is 1 or very near to 1, then the scattergram points fall along a straight line.
The first step in the demonstration is to create a fresh version of the stored procedure for computing the coefficient of determination in the same database as the two tables with time series data from Yahoo Finance and Stooq.com. The following script shows the code for creating a stored procedure for computing the coefficient determination in the DataScience database. You can change the use statement to reference any other database that you are using as a default database.
use DataScience
go

-- use to create a fresh version of the stored proc
-- with the create procedure statement
drop procedure if exists dbo.compute_coefficient_of_determination
go

-- from: https://www.mssqltips.com/sqlservertip/5506/tsql-starter-statistics-package-for-sql-server/
-- section: A stored procedure to compute a coefficient of determination
create procedure dbo.compute_coefficient_of_determination
as
  begin
      set nocount on
      -- compute coefficient of determination
      -- based on correlation coefficient
      select
         sum(y_minus_mean_sq)                                                                          sum_of_y_sq_devs,
         sum(x_minus_mean_sq)                                                                          sum_of_x_sq_devs,
         sum(x_y_mean_product)                                                                         sum_of_xy_product_devs,
         sum(x_y_mean_product) /( sqrt(sum(y_minus_mean_sq)) * sqrt(sum(x_minus_mean_sq)) )           correlation_coefficient,
         power(sum(x_y_mean_product) /( sqrt(sum(y_minus_mean_sq)) * sqrt(sum(x_minus_mean_sq)) ), 2) coefficient_of_determination
      from
     (
         -- compute power deviations from mean
         select
            x,
            y,
           ( x - avg_x )                 x_minus_mean,
            power(( x - avg_x ), 2)       x_minus_mean_sq,
           ( y - avg_y )                 y_minus_mean,
            power(( y - avg_y ), 2)       y_minus_mean_sq,
           ( x - avg_x ) *( y - avg_y ) x_y_mean_product
         from
        (
            -- inputs for coefficient of determination
            select *
            from  (select cast(x as float) x, cast(y as float)  y from ##temp_xy) source_date
            cross join(select avg(cast(y as float)) avg_y from ##temp_xy) avg_y
            cross join(select avg(cast(x as float)) avg_x from ##temp_xy) avg_x
         ) for_r_squared_inputs
      ) for_r_squared
      return
  end
  go
A review of the preceding script indicates that the stored procedure references two columns of data named x and y from a global temp table named ##temp_xy. In this tip, the x variable points to the close prices from the SQL Server table with close prices from Yahoo Finance, and the y variable points to the close prices from Stooq.com. The output from the stored procedure consists of a table with a single row of values. The last column value in the row is the coefficient of determination, and the prior columns are for supporting values used to compute the coefficient of determination.
In the context of the current tip, you can invoke the stored procedure in three steps that appear below. The following script implements all three steps. A row of dashed lines divides the steps from one another.
- The first step computes a fresh version of two tables.
- The first table is named ##temp_xy. As indicated above, this table is for storing the x and y column values.
- The second table is named ##record_from_coefficient_of_determination. This table eventually gets populated with the results set from the compute_coefficient_of_determination stored procedure.
- The second step populates the x and y columns in the ##temp_xy table, respectively, with close prices for the SPY ticker symbol from yahoo_finance_ohlcv_values_with_symbol and stooq_ohlcv_values_with_symbol.
- The third step invokes the compute_coefficient_of_determination stored procedure, saves its results set into the ##record_from_coefficient_of_determination global temp table, and displays the coefficient of determination column value along with a string value for the name of the ticker symbol (SPY).
use DataScience
go

-- create fresh versions source data table (##temp_xy) and
-- table (##record_from_coefficient_of_determination) with return values from
-- compute_coefficient_of_determination sp

-- source data tables for x and y time series data (##temp_xy)
-- that are compared to each with the coefficient of determination
drop table if exists ##temp_xy
drop table if exists ##record_from_coefficient_of_determination

create table ##temp_xy
(
   x float,
   y float
)
go

-- table holding output from
-- compute_coefficient_of_determination sp
create table ##record_from_coefficient_of_determination
(
   sum_of_y_sq_devs float,
   sum_of_x_sq_devs float,
   sum_of_xy_product_devs float,
   correlation_coefficient float,
   coefficient_of_determination float
)
go

----------------------------------------------------------------------------------

-- populate ##temp_xy with values for x and y
-- x holds close prices from Yahoo Finance (yf)
-- y holds close prices from Stooq.com (stooq)
-- x and y are filtered for a ticker symbol
insert into ##temp_xy
select
 yf.[close] x
,stooq.[close] y
from dbo.yahoo_finance_ohlcv_values_with_symbol yf
inner join
dbo.stooq_ohlcv_values_with_symbol stooq
on yf.symbol = stooq.symbol
and yf.date = stooq.date
where yf.symbol = 'SPY'
order by yf.date

----------------------------------------------------------------------------------

-- run the compute_coefficient_of_determination sp
-- save its output in ##record_from_coefficient_of_determination
-- display selected sp output
insert into ##record_from_coefficient_of_determination
exec dbo.compute_coefficient_of_determination

select
 'SPY' symbol
,coefficient_of_determination [coefficient of determination]
from ##record_from_coefficient_of_determination
The preceding script was edited to compute and display coefficients of determination for the SPY, QQQ, and DIA ticker symbols. This extended script is available in this tip’s download as coefficients_of_determination_between_yf_and_stooq.sql. The three results set for each ticker from the edited script appears below. The three ticker symbols are collectively based on many widely traded tickers. Consequently, they provide an outcome that is representative of all ticker symbols overall.
- As you can see, all three coefficients of determination are within .002 of the maximum coefficient of determination value of 1.000.
- This outcome confirms that Yahoo Finance and Stooq return nearly identical close price trends for the three ticker symbols.
- As a result, you can interchangeably use either data source for any analysis that depends on close prices across time series date values for any of the three tickers.

Next Steps
This tip drills down into process and T-SQL programmatic issues for migrating time series price and volume data from Stooq.com and Yahoo Finance to a SQL Server table. Two additional topics are also covered – namely, an introduction on how to pull a representative sample of ticker symbols for the whole US securities market and an introduction for a statistical approach to assess the similarity of two different datasets with time series for the same ticker symbol.
The download for this tip includes T-SQL script files and folders of edited csv files with price and volume time series data from Yahoo Finance and Stooq.com. With this download content,
- You can re-run the sample code described in this tip and get identical results.
- You can change the csv files so that they cover ticker symbols other than those used in this tip.
- If you pull fresh data for ticker symbols other than those used in this tip, then you may need to edit the downloaded csv files as described in the “An overview of the process for transferring time series data to SQL Server” section.

Rick Dobson is a SQL Server professional with decades of T-SQL experience that includes authoring books, running a national seminar practice, working for businesses on finance and healthcare development projects, and serving as a regular contributor to MSSQLTips.com. He has been a practicing Python developer for more than the past half decade – with a special emphasis for data visualization and ETL tasks with JSON and CSV files. His most recent professional passions include financial time series data and analyses, AI models, and statistics. If you are interested in growing your skills in any of these areas especially as they relate to financial securities, consider visiting his blog at https://securitytradinganalytics.blogspot.com/2023/12/.
- MSSQLTips Awards: Leadership (200+ tips) – 2025 | Author of the Year Contender – 2017-2024