Problem
Microsoft Power BI vs Tableau, that is the question. Which data visualization tool is better for reporting, data analysis and business intelligence?
Solution
This tutorial will compare Power BI and Tableau in different areas like price, functionality, platforms, user interface, ease of use and more. This will give you a guide as to which business intelligence tool might make more sense for your environment.
Tableau vs. Microsoft
Tableau is a newer company compared to Microsoft. It was founded in 2003 and specializes in BI and data visualization in general. This company was founded by Christian Chabot, Chris Stolte, and Pat Hanrahan, who were experts in data visualization at Stanford University.
Microsoft, on the other hand, was founded by Bill Gates and Paul Allen in 1975. Microsoft is the largest software company in the world, as you can see from the listing of Top 10 Software Companies:
- Microsoft
- Oracle
- SAP
- IBM
- Salesforce
- Adobe
- Fiserv
- ADP
- Dell
- Broadcom
Microsoft loves to integrate its tools, so it may win in the long run, in popularity. Currently, Power BI is part of the Power Platform as shown below.

Power BI is part of the Power Apps or Microsoft 365 E5. So, many companies have Power BI included with other Microsoft products. If your company has Microsoft 365 E5, you also have Power BI included as shown below.
Many companies currently have Microsoft 365 accounts, so they can take advantage of Power BI as part of the Microsoft suite of applications. On the other hand, Tableau has to be acquired separately.
Pricing Info
The prices in Tableau are easier to understand than Power BI because we can purchase Power BI with other Microsoft tools, which can reduce the licensing cost.
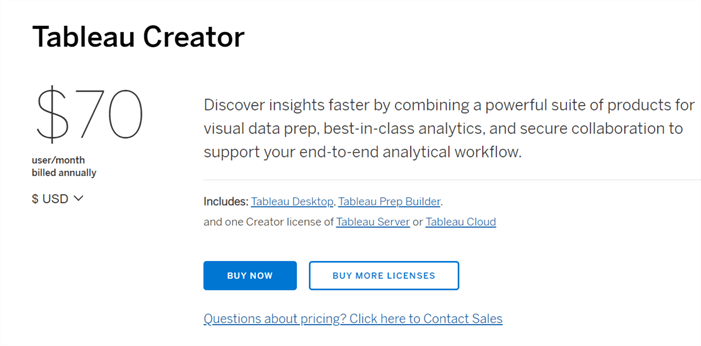
Tableau
Individual licenses are $70 USD per month.
Teams and organizations will pay the following:
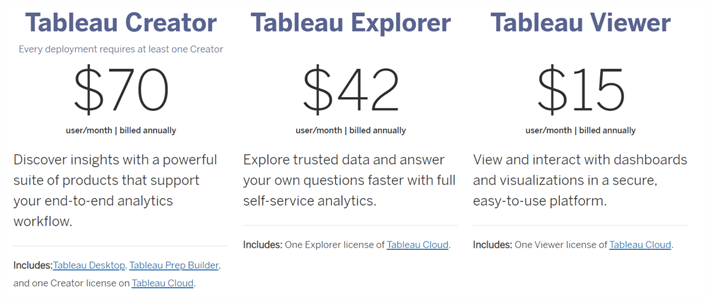
As you can see, there are additional options. Tableau Explorer is used to explore trusted data and answer questions using an analytics service, while Tableau Viewer is used to visualize dashboards and interact with them.
You can have Tableau Server or Tableau Cloud (recommended), both have the same price structure.
If you buy a Small Business license, the prices are the following:

For the Enterprise license, the prices are the following:
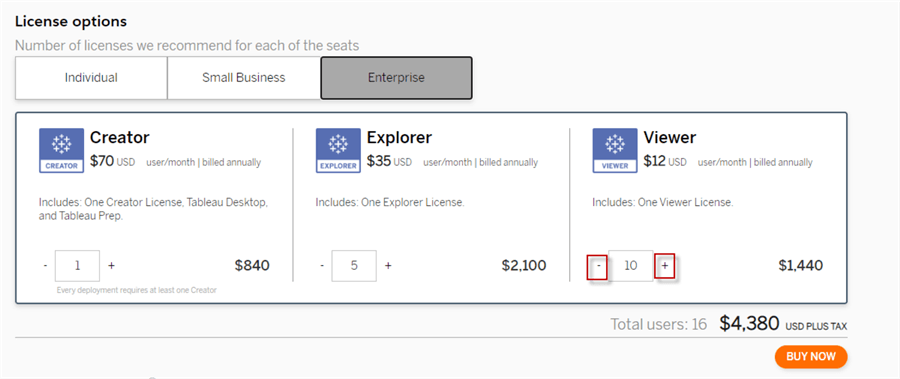
Note the + and – options to add or reduce the number of licenses if necessary.
Microsoft Power BI
Now let’s look at the Power BI prices.
Microsoft offers lower prices for Power BI Pro and Power BI Premium editions:
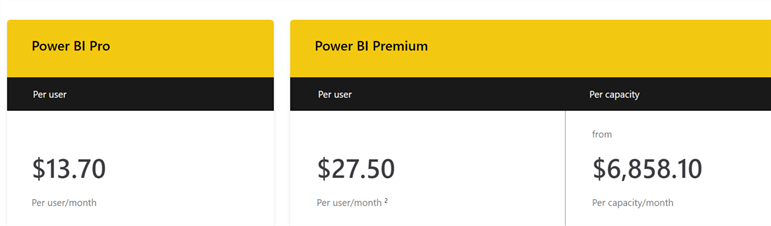
Power BI Pro is per user and the Power BI Premium is per organization.
The License per capacity has no limit of users. If your company is big, this can save you a lot of money. This license helps you to share dashboards and reports to all members within the company without each member needing a paid Power BI license. This license can auto-scale and improve performance if necessary.
Deploying Reports and Interface
Tableau
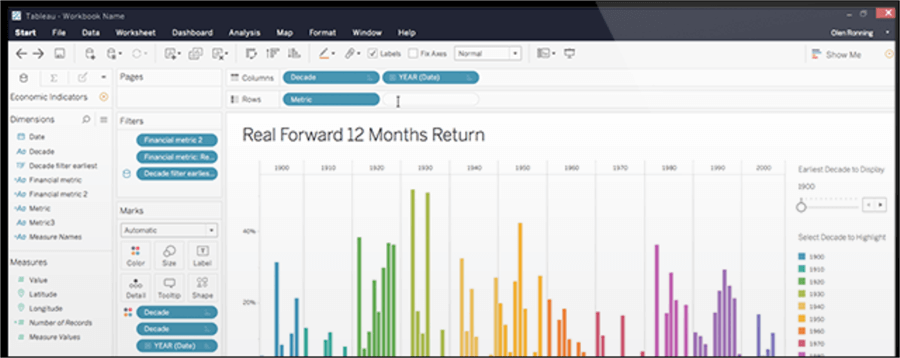
This is what the Tableau interface looks like.
In order to publish a Workbook in Tableau, refer to this link:
Power BI
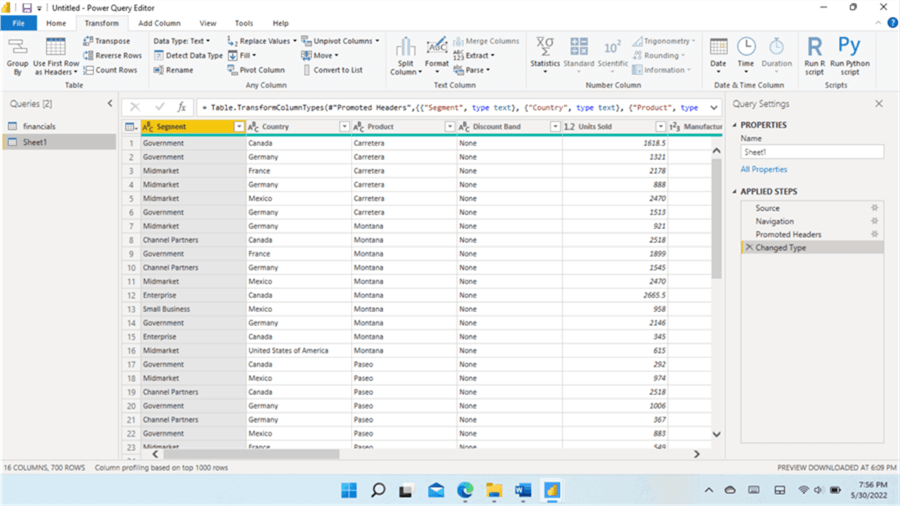
Here is the interface for Power BI.
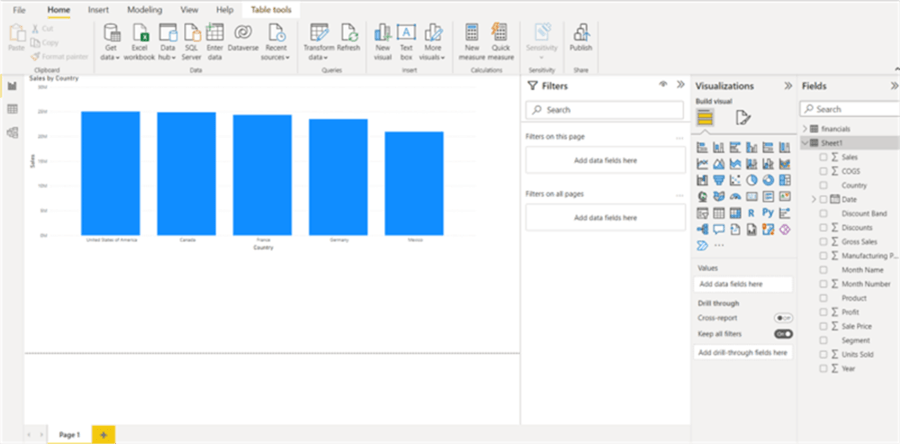
And here is a sample report.
In order to publish reports for Power BI, please refer to these articles:
Trial Editions
Tableau
You can use Tableau Public which is free. Also, Tableau desktop offers a trial for 14 days. Tableau public offers public data while the Desktop version is private. You have a limited number of data sources supported in Tableau Public like Excel, text files, JSON, PDF, special files, statistical files, OData, and web. Also, the public version does not support data updates in real-time.
Power BI
There is a Power BI Free license. This license does not allow sharing or collaboration.
Add-Ons to Extend Features
Tableau
For Tableau, we have several extensions available at this link:
Power BI
In Power BI you can integrate external tools. The following article shows how to do it:
Also, you can import new visuals in Power BI reports. The following article explains how to import visuals:
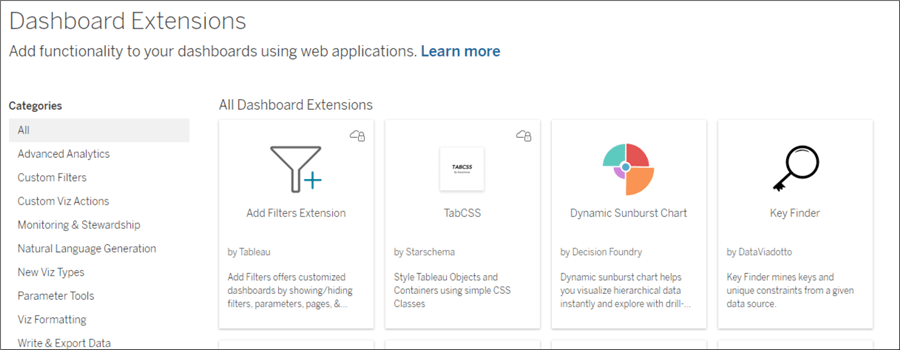
There are also extensions to work with bubbles, special filters, work with CSS Classes, Key Finder, and several extra tools as shown below.
Which is More Popular
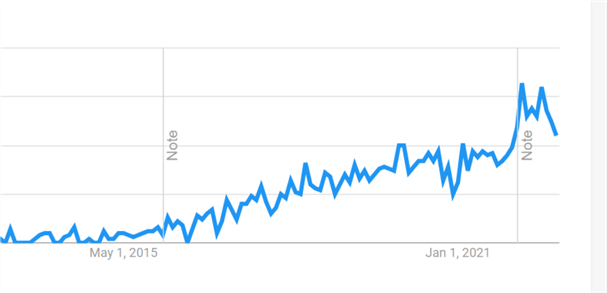
Looking at Google Trends, we have this chart for Power BI Software that has grown fairly consistently since 2014:
On the other hand, for Tableau software, we have this chart from 2004 to 2022:
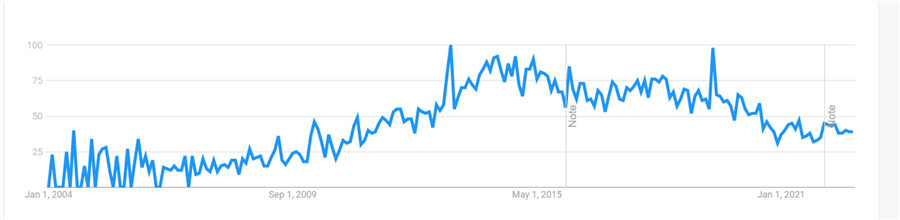
As you can see from these charts, the popularity of Power BI searches is still growing. Tableau searches have been on a decline, but that may change if Tableau increases its product awareness.
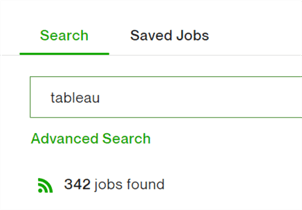
Tableau is still very popular and there are several jobs for this technology. However, in general, the number of jobs for Power BI is higher. I tried looking for jobs in Upwork and found 716 jobs for Power BI.
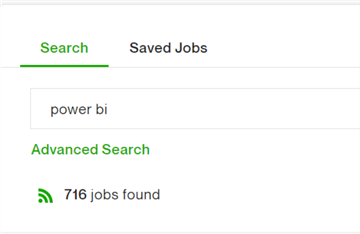
I found 342 jobs for Tableau.
You will generally find more jobs and activity online about Power BI. However, Tableau is still one of the most important BI tools used in the market. Learning both tools (which are not so different) may be beneficial for your CV.
Scripting Language
Tableau
Tableau supports Python and R.
Here is additional information:
- Using R and Tableau
- How to pair Tableau and Python for prescriptive analytics with TabPy
- Use Python scripts in your flow
Power BI
Power BI supports R and Python. Here are some related articles:
- Load API Data to SQL Server Using Python and Generate Report with Power BI
- Transform Data in Power BI with R and Python
- Generate visualizations in Power BI using Python Scripts
- Getting started with R scripts and R visuals in Power BI Desktop
- Import data dynamically using R and Python in Power BI Desktop
Supported Data Sources
Tableau
According to the documentation, Tableau supports these various data sources:
- Microsoft Excel
- Text File
- Microsoft Access
- JSON File
- PDF File
- Spatial File
- Statistical File
- Other Files
- Tableau Server or Tableau Cloud
- Actian Matrix
- Actian Vectorwise
- Alibaba AnalyticDB for MySQL
- Alibaba Data Lake Analytics
- Alibaba MaxCompute
- Amazon Athena
- Amazon Aurora for MySQL
- Amazon EMR Hadoop Hive
- Amazon Redshift
- Anaplan
- Apache Drill
- Aster Database
- Azure Data Lake Storage Gen2
- Azure SQL Database
- Azure SQL Synapse Analytics
- Box
- Cloudera Hadoop
- Databricks
- Datorama by Salesforce
- Denodo
- Dremio by Dremio
- Dropbox
- Esri Connector
- Exasol
- Firebird 3
- Google Ads
- Google Analytics
- Google BigQuery
- Google Cloud SQL
- Google Drive
- Google Sheets
- Hortonworks Hadoop Hive
- IBM BigInsights
- IBM DB2
- IBM PDA (Netezza)
- Impala
- Intuit QuickBooks Online
- Kognitio
- Kyvos
- LinkedIn Sales Navigator
- MapR Hadoop Hive
- MariaDB
- Marketo
- MarkLogic
- Microsoft Analysis Services
- Microsoft PowerPivot
- Microsoft SQL Server
- MonetDB
- MongoDB BI Connector
- MySQL
- OData
- OneDrive
- Oracle
- Oracle Eloqua
- Oracle Essbase
- Oracle Netsuite
- Pivotal Greenplum
- PostgreSQL
- Presto
- Progress OpenEdge
- Qubole Presto
- Salesforce
- Customer Data Platform
- Marketing Cloud
- Splunk
- SAP HANA
- SAP NetWeaver Business Warehouse
- SAP SuccessFactors
- SAP Sybase ASE
- SAP Sybase IQ
- ServiceNow ITSM
- SharePoint Lists
- SharePoint Lists (JDBC)
- SingleStore
- Snowflake
- Spark SQL
- Teradata
- Teradata OLAP Connector
- TIBCO Data Virtualization (Cisco Information Server)
- Vertica
- Web Data Connector
- Other Databases (JDBC)
- Other Databases (ODBC)
Power BI
Power BI supports these various data sources:
- SQL Server database
- Access database
- SQL Server Analysis Services database
- Oracle database
- IBM Db2 database
- IBM Informix database (Beta)
- IBM Netezza
- MySQL database
- PostgreSQL database
- Sybase database
- Teradata database
- SAP HANA database
- SAP Business Warehouse Application Server
- SAP Business Warehouse Message Server
- Amazon Redshift
- Impala
- Google BigQuery
- Vertica
- Snowflake
- Essbase
- Actian (Beta)
- Amazon Athena
- AtScale cubes
- BI Connector
- Data Virtuality LDW
- Denodo
- Dremio Software
- Dremio Cloud (Beta)
- Exasol
- Indexima
- InterSystems IRIS (Beta)
- Jethro (Beta)
- Kyligence
- Linkar PICK Style / MultiValue Databases (Beta)
- MariaDB
- MarkLogic
- TIBCO(R) Data Virtualization
- Azure SQL Database
- Azure Synapse Analytics SQL
- Azure Analysis Services database
- Azure Database for PostgreSQL
- Azure Blob Storage
- Azure Table Storage
- Azure Cosmos DB
- Azure Data Explorer (Kusto)
- Azure Data Lake Storage Gen2
- Azure Data Lake Storage Gen1
- Azure HDInsight (HDFS)
- Azure HDInsight Spark
- HDInsight Interactive Query
- Azure Cost Management
- Azure Databricks
- Azure Synapse Analytics workspace (Beta)
- Azure Time Series Insights (Beta)
- SharePoint Online List
- Microsoft Exchange Online
- Dynamics 365 Online (legacy)
- Dynamics 365 (Dataverse)
- Dynamics NAV
- Dynamics 365 Business Central
- Dynamics 365 Business Central (on-premises)
- Azure DevOps (Boards only)
- Azure DevOps Server (Boards only)
- Salesforce Objects
- Salesforce Reports
- Google Analytics
- Adobe Analytics
- appFigures (Beta)
- Data.World – Get Dataset (Beta)
- GitHub (Beta)
- LinkedIn Sales Navigator (Beta)
- Marketo (Beta)
- Mixpanel (Beta)
- Planview Enterprise One – PRM (Beta)
- QuickBooks Online (Beta)
- Smartsheet
- SparkPost (Beta)
- SweetIQ (Beta)
- Planview Enterprise One – CTM (Beta)
- Zendesk (Beta)
- Asana (Beta)
- Assemble Views
- Automation Anywhere
- Automy Data Analytics (Beta)
- Dynamics 365 Customer Insights (Beta)
- Emigo Data Source
- Entersoft Business Suite (Beta)
- eWay-CRM
- FactSet Analytics
- Palantir Foundry
- Funnel
- Hexagon PPM Smart API
- Industrial App Store
- Intune Data Warehouse (Beta)
- Projectplace for Power BI
- Product Insights (Beta)
- Profisee (Beta)
- Quick Base
- SoftOne BI (Beta)
- Spigit (Beta)
- TeamDesk (Beta)
- Webtrends Analytics (Beta)
- Witivio (Beta)
- Viva Insights
- Zoho Creator (Beta)
- Web
- SharePoint list
- OData Feed
- Active Directory
- Microsoft Exchange
- Hadoop File (HDFS)
- Spark
- Hive LLAP
- R script
- Python script
- ODBC
- OLE DB
- Acterys : Model Automation & Planning (Beta)
- Amazon OpenSearch Service (Beta)
- Anaplan Connector Autodesk Construction Cloud (Beta)
- Solver
- BitSight Security Ratings
- BQE Core
- Bloomberg Data and Analytics
- Cherwell (Beta)
- Cognite Data Fusion
- Delta Sharing
- Eduframe (Beta)
- EQuIS (Beta)
- FactSet RMS (Beta)
- FHIR
- Google Sheets (Beta)
- Information Grid (Beta)
- Jamf Pro (Beta)
- Kognitwin
- MicroStrategy for Power BI
- OpenSearch Project (Beta)
- Paxata
- QubolePresto (Beta)
- Roamler (Beta)
- SIS-CC SDMX (Beta)
- Shortcuts Business Insights (Beta)
- SingleStore Direct Query Connector 1.0 (Beta)
- Siteimprove
- Socialbakers Metrics 1.1.0 (Beta)
- Starburst Enterprise
- SumTotal
- SurveyMonkey (Beta)
- Microsoft Teams Personal Analytics (Beta)
- Tenforce (Smart)List
- Usercube (Beta)
- Vena
- Vessel Insight
- Zucchetti HR Infinity (Beta)
- Blank Query
Power BI has 155 data sources registered in the documentation, while Tableau has 92.
Query Languages
Tableau
MDX is used by Tableau.
Power BI
DAX is used for Power BI.
In general, MDX is harder to learn and DAX is similar to Excel functions, but for complex queries DAX can also be complicated.
Certifications for Tableau and Power BI
Tableau
There are several certifications for Tableau:
For partners, you have these certifications:
Power BI
For Power BI, the main exam is the PL-300 Exam. Another certification is the DP-500 which requires Power BI plus other technologies:
Which Tool is Better – Key Differences
I love the Power BI interface, it looks modern, fresh and is user-friendly. The learning curve for Power BI is also shorter than Tableau.
I think Tableau is less intuitive and harder to learn. However, Tableau has been available longer providing more options. You can create more sophisticated reports if you have good knowledge of Tableau.
When it comes to performance, Tableau is the best option. It is faster for a high volume of data. In general, the experts recommend Tableau for medium to large companies and Power BI for small to medium companies.
In general, you can use both tools for almost the same purposes. There is no one perfect answer between these tools; both are fantastic. If you want more advanced features and a more complex and sophisticated tool, use Tableau. If you want an intuitive and easy to learn tool, work with Power BI. Power BI also has an easier learning curve. Another factor that may influence your decision is the price. In general, Power BI is a cheaper option. Finally, verify the Data Sources that you need to support.
We can say that the best tool for reporting, analytics, and business intelligence is Tableau. It is more sophisticated and it includes more options to get the information and analyze the data. It is harder to learn and use, but once you understand it, it is a very powerful tool.
Next Steps
- Check out these other Power BI articles.

Daniel Calbimonte is a Microsoft Most Valuable Professional, Microsoft Certified Trainer and Microsoft Certified IT Professional for SQL Server. He is an accomplished SSIS author, teacher at IT Academies and has over 10 years of experience as a QE and developer for SQL Server related software. He has worked for the government, oil companies, web sites, magazines and universities around the world. Daniel also regularly speaks at SQL Servers conferences and blogs.
- MSSQLTips Awards: Author of the Year Contender – 2015-2018, 2022, 2023 | Champion (100+ tips) – 2018


