By: Daniel Farina | Comments (4) | Related: > Performance Tuning
Problem
At some point you are going to experience issues with database performance. You need to have a process to follow and certain tasks that you should perform. In this tip I provide steps to help you build a standard troubleshooting guide.
Solution
A situation that a SQL Server database administrator can face is solving an incident in a production environment. An incident involving an online service with high concurrent usage could be one of the most challenging tasks you will face. Suppose you work as a DBA for Ebay; what would happen if this website is unresponsive and the webmaster sends you an email stating that the error logs shows several "Database Timeout" messages. Your phone will start ringing, even your cell phone and suddenly you will be surrounded by many people like your boss, managers, area managers and even the CTO just to make things worse. Depending on how you handle the situation it could increase your value to the company (if you solve the situation quickly who would deny you a salary increase) or on the other hand you could get fired.
I have lived situations like the one described and the outcome was positive, so I want to share with you what I've learned. If you haven't experienced a situation when you save the day, then get prepared for when it happens.
First Step: Pull Yourself Together
You are the person to solve the problem, so you need to be calm even when the people around you aren't calm. You can't provide a solution if you don't work in an orderly fashion even if you are the person who should know how to fix the problem.
Second Step: Check the Application's Database
Now that you are calm you are ready to check the status of the application's database. I created a set of questions that you should answer in order to solve the problem.
Is there SQL Server locking and blocking?
When an application is unresponsive it could be that the application's request to the database is queued because of a session blocking a resource. If this is the case, before killing the blocking session you should take a look at what code the session is executing and where did the session originate. Why? Because if this blocking session is from the application the most probable scenario is that when you kill it another session will run the same code, so you have to keep looking for the answer. But if the blocking session is because someone left a transaction opened and went out for a coffee, then you can probably kill it.
You can get information on blocking with the following query:
SELECT *
FROM sys.dm_exec_requests
CROSS APPLY sys.dm_exec_sql_text(sql_handle)
Here are other resources on locking and blocking:
Are other applications running on the same server having issues?
This item should not be overlooked, because you can deduce that if the problem is the server then all applications running on the server should have problems. If this isn't the case, then the problem isn't the database engine, but the application which leads us to the next question.
Did the application have any recent changes?
It could be that the application was altered without you being aware of it. Even if no stored procedures were changed, the application's front end could have been altered in such a way that creates performance degradation. It could be the case that the application uses a framework like Hibernate for data persistence meaning that the SQL code is not created by the programmer himself. On the other hand, a web programmer could add Ad-Hoc queries within the code making you unaware of any changes in the SQL code.
Even the application's configuration file could have been changed without your knowing. Some parameters related to maximum number of simultaneous connection, connection pooling or enabling implicit transactions can have a detrimental effect on database performance.
Does the database have enough available free space?
This is another fact that you should be aware of. You can check available hard disk free space with the xp_fixeddrives extended stored procedure.
But even if the hard disk has plenty of free space it could be that the database autogrowth is disabled or the autogrowth is set to a percentage of the file size instead of in megabytes. For example, if your database file is 2TB and the autogrowth is set to 10%, then you need 200GB of free space on the drive in order for the file to grow.
Check out these resources for more info:
- Determine Free Disk Space in SQL Server with TSQL Code
- Collect SQL Server database usage for free space and trending
- Different ways to determine free space for SQL Server databases and database files
Third Step: Focus on the SQL Server Instance
To quickly get an overview of the instance I recommend you use the Performance Dashboard Reports available for free from this link http://www.microsoft.com/en-us/download/details.aspx?id=29063. With this report you can see if your SQL Server instance is under CPU pressure and the actual waiting tasks.
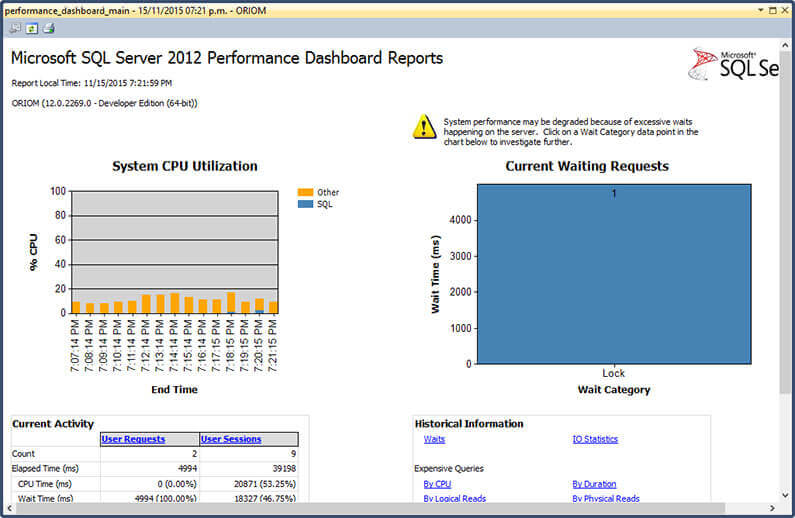
According to the waiting task type you can get a clue as to what is going on. For example, the previous image shows that at the time of the report execution there was a locking issue in the instance, but you can get other wait types like SOS_SCHEDULER_YIELD or CXPACKET that will tell you that the problem is related to parallelism. You should take a look at the list of wait types and their descriptions on the MSDN help page for the sys.dm_os_wait_stats Dynamic Management View.
Are your log files fragmented?
If your log files are fragmented with a high amount of VLF files you will see a lot of WRITELOG wait types. This is very detrimental for performance.
Is the disk access time correct?
SQL Server needs a disk access time below 30 milliseconds to operate properly. The quickest way to check for this is to open the SSMS Activity Monitor, expand the Data File I/O view and sort it by Response Time in descending order.
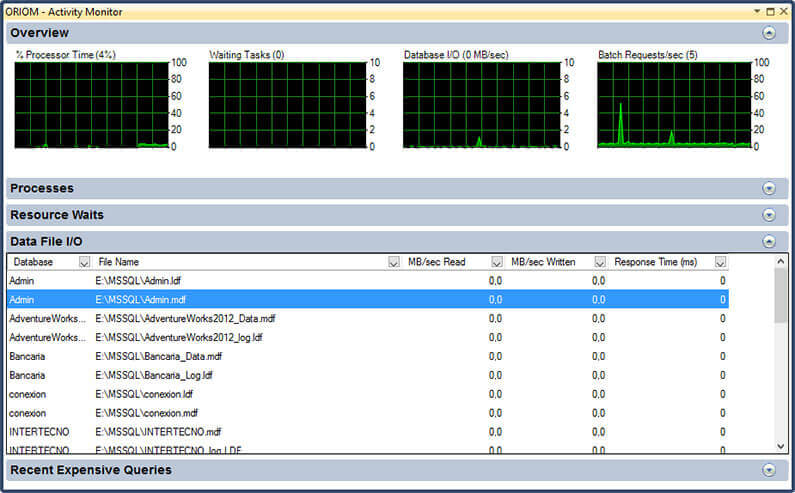
A high disk access time could be due table or index fragmentation or because of a problem with the disk subsystem.
What information is in the SQL Server Error Log?
In order to discard a problem with the disk subsystem we should take a look at the error log for messages relative to long I/O requests, bad pages or dumps. You can execute the following stored procedure to view the contents of the error log.
sp_readerrorlog
Check out these resources:
Does the application access data through a linked server?
This is something that you must always consider when you are troubleshooting an application's database. The cause is simple: you could be looking for problems on the wrong server. The easiest way to look if there is an issue with a linked server is to look for excessive OLEDB wait tasks in the Performance Dashboard report.
Are the statistics current?
If your database statistics are not up to date, it will cause the query optimizer to not have the right information to build the best query plan. For example, the optimizer could opt for a parallel plan when a nonparallel plan was the best option making you think that you have something wrong with the max degree of parallelism because you see lots of SOS_SCHEDULER_YIELD or CXPACKET waiting tasks. If this is the case you should update the statistics right away and then execute the DBCC FREEPROCCACHE command to clear the procedure cache so new plans can be built using the updated statistics.
EXEC sp_updatestats
GO
DBCC FREEPROCCACHE()
GO
Next Steps
- You can learn how to install the SQL Server Performance Dashboard reports in this tip: Install SQL Server 2012 Performance Dashboard Reports.
- For more help troubleshooting blocking check out the Troubleshooting Blocking tutorial.
- This tip will explain you how to Detect SQL Server CPU pressure.
- Also if your problem is CPU related I suggest that you read this tip: How to Identify SQL Server CPU Bottlenecks.
- For more information about CXPACKET wait type read A closer look at CXPACKET wait type in SQL Server.
- When you are troubleshooting wait types you should look at sys.dm_os_waiting_task as well as sys.dm_os_wait_stats Dynamic Management View. So the following tip will give you an insight: SQL Server sys.dm_os_wait_stats DMV Queries.
- If you don't know how to check if your database files have enough free space check this out: Determine Free Space, Consumed Space and Total Space Allocated for SQL Server databases.
- The following tip will show you how you can monitor the free space of the transaction log: Monitor SQL Server Transaction Log File Free Space.
- If you don't know what VLF means check out this tutorial: What is a Virtual Log File (VLF)?
- The following tip will show you the importance of having statistics up to date: Issues Caused by Outdated Statistics in SQL Server.
- After reading the previous tip check out Performance Issue with large number of Virtual Log Files in SQL Server Transaction Log.
- You can control your VLF with policy based management according to this tip: Monitor Your SQL Server Virtual Log Files with Policy Based Management.
- You can find more tips about Linked Servers on Linked Servers Tips Category.
- If you want to avoid problems in your instance you should do maintenance work. If you don't know how or need to go further, check out Maintenance Tips Category.
- Also check out Performance Tuning Tips Category.


About the author
 Daniel Farina was born in Buenos Aires, Argentina. Self-educated, since childhood he showed a passion for learning.
This author pledges the content of this article is based on professional experience and not AI generated.
View all my tips
