Problem
Please present some T-SQL code on comparing artificial intelligence models to guide decision-making. Also, demonstrate how to combine two models into a new model to reveal issues for combining models and to determine if a combined model performs better than its source models.
Solution
Previous tips in MSSQLTips.com demonstrated different approaches to calculating, with T-SQL, buy and sell recommendations for stocks with technical indicators for stocks. This kind of application illustrates artificial intelligence because a computer program (that can be written in T-SQL) rather than a human recommends when to buy and sell stocks. Each previous tip about buying and selling stocks focused on either introducing or improving the performance of a single technical indicator.
Human decision-making can be modeled – particularly when the focus is on decisions that are frequently performed and for which there are rules based on data. Examples of these kinds of decision-making include
- Deciding when it is time to buy or sell a stock
- Deciding whether to extend credit to a potential customer
- Evaluating qualifying sites for a new chain store outlet
Each of these examples puts resources at risk for a potential gain. In the case of buying and selling a stock, the gain comes from the sell price being greater than the buy price. In the case of evaluating the credit-worthiness of potential customers, the gain results from reducing the amount of loans that end in default. For the store location task, the objective is to decide on locations that generate cash flow greater than or equal to a required amount for store viability.
When humans make decisions about options for which there are decision rules based on data, then these decision-making tasks are candidates for replacement or assistance by artificial intelligence models. The models can automate the processing of data for options according to a set of rules and recommend a decision. When there are different reasonable sets of rules about how to decide, then the outcomes from the rule sets can be compared. Also, if some rule sets work better in some scenarios than others, then different model outcomes can be combined into a single model outcome set to optimize automated decision-making based on multiple rule sets. This tip demonstrates these tasks for deciding about when to buy and sell stocks. However, the general approach applies to any kind of decision-making task where rules are used to recommend decisions about options based on data.
An introduction to the original five artificial intelligence models
This tip drills down on how to apply code made available in a prior tip for five different models based on three stock technical indicators. Two of the technical indicators each have two models based on them and one technical indicator has a single model based on it.
The artificial intelligence models within this tip are based on three technical indicators:
- The MACD (Moving Average Convergence Divergence) line and its signal line
- The RSI (Relative Strength Index)
- Relationships among a set of moving averages with different period lengths
You can learn more about each of these indicators from prior tips that present T-SQL code for computing them as well as how to use them to make recommendations about when to buy and sell stocks. While the details of artificial intelligence models for when to buy and sell stocks and comparisons between them can be highly complicated, this tip enables you to grasp the big picture about how to compare artificial intelligence models without requiring that you learn all the programming details. For example, there are two main metrics for comparing artificial intelligence models about when to buy and sell stocks.
- You can compute the change in close price within each buy and sell pair or over the set of all buy and sell pairs. The greater the sell prices relative to the buy prices, the more beneficial is the artificial intelligence model.
- A second metric that works especially well for individual pairs of buy and sell recommendations is the change in close price divided by the buy price. Larger more positive close change percent values indicate better performance for individual pairs of buys and sells.
The code for this tip pulls an objective sample of ten stock symbols from the list of all NASDAQ stock symbols that were collected for a database of historical price and volume data initially presented in a prior tip. All comparisons across techniques for calculating buy and sell date recommendations use the same set of ten symbols. The objective sample is based on the following rules for selecting stock symbols from the AllNasdaqTickerPricesfrom2014into2017 database.
- Each stock symbol must have a minimum number of daily traded shares of 100,000. This requirement is to ensure that stocks used for testing buy/sell recommendations are easily traded.
- Each stock was required to have data for a minimum of 900 trading days. This ensures that each stock symbol has plenty of data for which to compare buy and sell date recommendations derived from the different techniques.
- All stock symbols must have their most recent trading day on either November 7 or 8, 2017. The historical stock price data were collected from Yahoo Finance while updates for the current day of trading (November 8, 2017) were still in progress. So, the last trading day could be November 7 or 8, 2018. If a stock has historical data for neither of these two days, then it is not traded on a daily basis, and the stock is excluded from consideration for this tip.
- The minimum close price for a stock symbol must be at least $5. Institutional investors, which control the bulk of share transactions, tend to avoid stocks with a share price below $5.
Here are some links that present T-SQL code for computing the three technical indicators and/or how to use the indicators to derive buy/sell recommendations.
- Mining Stock Price Time Series with MACD in SQL Server
- Using Two Samples to Validate MACD with T-SQL
- Using T-SQL to Detect Stock Price Reversals with the RSI
- A T-SQL Model for Contrasting Two Different Sets of Measurements
- Using T-SQL to Quantify Trend Direction and Strength
The table below presents a summary of the initial set of five artificial intelligence models compared in this tip. The descriptive comments column includes plain English remarks that describe the artificial intelligence model named in the first column. You can also use the descriptive comments column as a starting point for creating your own custom artificial intelligence models for generating stock buy and sell recommendations.
Each artificial intelligence model designates buy and sell recommendations with a date and close price for both the buying and selling of a stock. Because the technical indicators process historical price data differently, the dates for and number of buy and sell recommendations calculated by each model can be different — even when using the exact same historical price data. When the conditions for making a sell recommendation are not met, a model can fail to recommend a sell date for a buy date.
| Model name | Technical indicators used | Descriptive comments |
|---|---|---|
| macd cycles ending just before below centerline | MACD line indicator | |
| macd cycles ending below signal line | MACD line indicator and signal line indicator | |
| rsi cycles with rsi ends | RSI | |
| rsi cycles with macd ends | RSI, MACD line, and signal line indicators | |
| trend up trades | Multiple moving average indicator |
The resources for implementing each of the five artificial intelligence models include the database named AllNasdaqTickerPricesfrom2014into2017 and several script files for generating buy and sell recommendations derived from each model. The Next Steps section within this tip provides step-by-step instructions on how to download and operate the resources to develop the recommendations, compare the recommendations from different models, and combine two different models to generate outcomes better than either of the original models.
Four script files generate recommendations for each of the artificial intelligence models. One script file populates a temporary table with ten stock symbols; these are for investment grade stocks with plenty of data in the AllNasdaqTickerPricesfrom2014into2017 database. The remaining three script files calculate buy and sell recommendations for each of the ten stock symbols based on the description for each model.
- The macd_cycle_performance.sql script file creates the ##macd_start_end_early_fixed_results table.
- Columns close_change_amt and close_change_prcnt contain the two main metrics for comparisons based on the macd cycles ending just before below centerline model.
- Columns close_change_amt_early_fixed and close_change_prcnt_early_fixed contain the two main metrics for comparing models based on the macd cycles ending below signal line model.
- The rsi_cycle_performance.sql script file creates the two temporary tables.
- The close_change_amt and close_change_prcnt columns from the ##close_changes_with_rsi_ends table contain the two main comparison metrics for the rsi cycles with rsi ends model.
- The close_change_amt and close_change_prcnt columns from the ##close_changes_with_macd_ends table contain the two main comparison metrics for the rsi cycles with macd ends model.
- The trend_up_performance.sql script file creates a single table named ##mma_trend_up_with_close_vals. The close_change_amt and close_change_prcnt columns from the table contain the two main comparison metrics for the trend up trades model.
- In addition to the two main metrics for comparing models each row within the temporary table for a model contains a symbol along with two columns to denote the start and end of each buy/sell cycle. These three identifier columns identify each buy/sell cycle from a model.
- Each cycle is for a symbol.
- Each cycle starts at the start date.
- Each cycle ends at the end date.
Processing the results from the original five artificial intelligence models
The temporary tables with buy and sell dates and close prices for each artificial intelligence model have the same form factor, but the contents are different. This section starts with a quick examination of temporary tables for the trend up trades model and the rsi cycles with macd ends model. Both models draw on the same underlying historical stock close price data, but intermediate data and data processing rules are different as specified in the preceding table summarizing the original five artificial intelligence models.
The following screen shot shows an excerpt from the ##mma_trend_up_with_close_vals table along with the script for displaying all trades for the trend up trades model; the source column denotes the data are from the trend up trades model. The from clause references the ##mma_trend_up_with_close_vals temporary table because this is where the code for the trends up trades model deposits comparison data that adheres to its rules for selecting buy/sell cycles.
- The bottom border indicates that there are 107 buy/sell cycles returned by the code for the trend up trades model.
- The data are sorted by the start date for cycles within symbol.
- The first eleven rows are for buy/sell cycles for the ALGN stock symbol. The first ALGN buy/sell cycle starts on 2014-01-06 and runs through 2014-01-31.
- The seven rows after the first eleven for the ALGN symbol are for buy/sell cycles for the AMZN stock symbol.
- Rows nineteen through twenty-eight (and several additional rows beyond row twenty-eight) are for buy/sell cycles of the AVGO stock symbol.
- Across the buy/sell cycles for the three stock symbols showing in the excerpt, there are some obvious differences.
- The number of buy/sell cycles varies by symbol. The model identifies different buy/sell cycles for different symbols.
- Also, the number of buy/sell cycles with a positive close change amount is different by symbol.
- The ALGN symbol has eight of eleven buy/sell cycles with a loss — that is, the sell price is less than the buy price.
- The AMZN symbol has three of seven buy/sell cycles with a loss.
- Of the ten rows showing for the AVGO symbol, two of ten denote a buy/sell cycle with a loss. Recall that there are additional AVGO rows that do not show in the excerpt below.

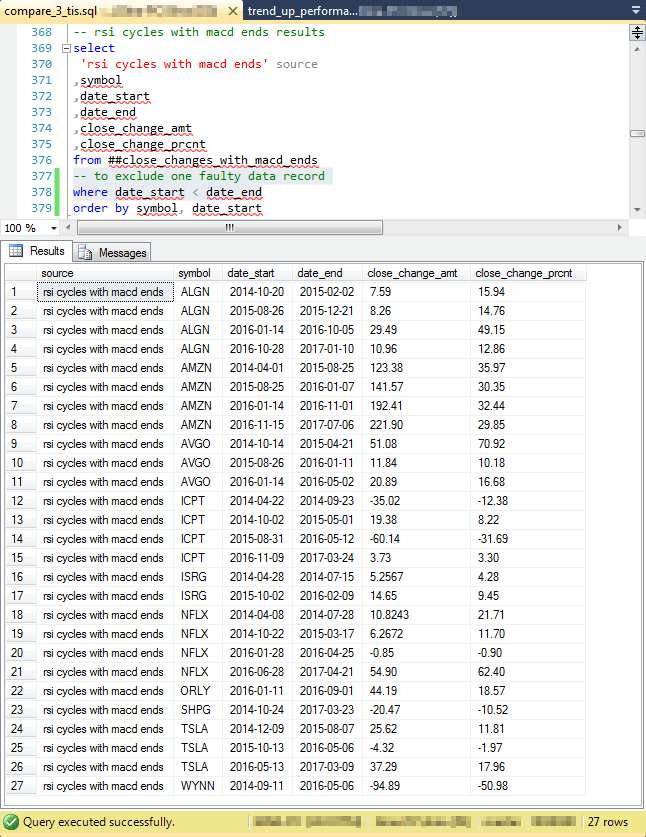
The next screen shot shows the full set of twenty-seven valid buy/sell cycles for the rsi cycles with macd ends model. As the script at the top of the screen shows, the rows in the Results tab are from the ##close_changes_with_macd_ends global temporary table.
- Unit tests for the ##close_changes_with_macd_ends global temporary table discovered one record with data that did not permit the calculation of a valid sell date for the rsi cycles with macd ends model code. The where clause excludes the invalid record. The issue did not manifest itself elsewhere. The fix for the data record is included in all subsequent queries within this tip that pertain to rsi cycles with macd ends buy/sell recommendations.
- The screen shot below is for the set of valid buy/sell cycles because the rsi cycles with macd ends model detects just twenty-seven valid cycles out of a possible twenty-eight from the underlying data. The number of times the rsi cycles with macd ends model criteria are met is rarer than the number of times the trend up trades model criteria are met.
- Not only are the number of buy/sell cycles different but the number of losses is different by symbol. All four of the ALGN symbol rsi cycles with macd ends buy/sell cycles are for gains, but the trend up trades model reported eight of eleven buy/sell cycles with losses (in the preceding screen shot).
- Also, the rsi cycles with macd ends model reports just 3 buy/sell cycles for the AVGO symbol, but the trend up trades model reports more than ten buy/sell cycles. Additionally, none of the buy/sell cycles for the AVGO symbol from the rsi cycles with macd ends model resulted in losses in the following screen shot, but two of the first ten AVGO buy/sell cycles reported by the trend up trades model resulted in losses in the preceding screen shot.
Another way to examine the buy/sell cycles derived from the artificial intelligence models is to perform a cross tabulation for a selected set of metrics across artificial intelligence models. The next script tabulates the following set of metrics for each of the five original artificial intelligence models. The first three metrics in the list below are tabulated on a count and a percentage point basis where the percentage is based on each count for a metric divided by the count over all three metrics for each model. Here’s a summary of the metric descriptions.
- Buy/sell cycles with more than a twenty-point percentage gain between buy and sell prices
- Buy/sell cycles with a gain that is twenty percent or less between buy and sell prices
- Buy/sell cycles with a percentage point change between buy and sell prices that is less than or equal to zero
- Count of buy/sell cycles
- Sum of close change amount across buy/sell cycles for a single share
The script for computing the tabulation for metrics by artificial intelligence models nests a query for all buy/sell cycles across the artificial intelligence models inside another query that categorizes each buy/sell cycle by whether it is for a gain of more than twenty percent, a gain of less than or equal to twenty percent, or no gain. The outermost query with a group by clause computes the final results for the cross tabulation of the metrics across the artificial intelligence models.
-- cross tab for source (artificial intelligence model)
-- by selected metrics
select
source
,sum(gt_20) gt_20_count
,sum(gt_0) gt_0_count
,sum(le_0) le_0_count
,
sum(gt_20)
+sum(gt_0)
+sum(le_0)
[count of cycles]
,
round(
cast(sum(gt_20) as float)
/
cast
(
 (
 sum(gt_20)
 +
 sum(gt_0)
 +
 sum(le_0)
 )
 as float
) * 100
,2) [prct source gt_20]
,
round(
cast(sum(gt_0) as float)
/
cast
(
 (
 sum(gt_20)
 +
 sum(gt_0)
 +
 sum(le_0)
 )
 as float
) * 100
,2) [prct source gt_0]
,
round(
cast(sum(le_0) as float)
/
cast
(
 (
 sum(gt_20)
 +
 sum(gt_0)
 +
 sum(le_0)
 )
 as float
) * 100
,2) [prct source le_0]
,sum(close_change_amt) [sum of close change amt]
from
(
-- zero-one close_change_prcnt_cats
select
*
,
case
when close_change_prcnt > 20 then 1
else 0
end gt_20
,
case
when close_change_prcnt > 0
and close_change_prcnt <= 20 then 1
else 0
end gt_0
,
case
when close_change_prcnt <= 0 then 1
else 0
end le_0
from
(
-- union of all trades for all technical indicators by all techniques
-- macd cycles ending just before below centerline results
select
 'macd cycles ending below centerline' source
,symbol
,date_start
,date_end
,close_change_amt
,close_change_prcnt
from ##macd_start_end_early_fixed_results
union
-- macd cycles ending below signal line results
select
 'macd cycles ending below signal line' source
,symbol
,date_start
,date_early
,close_change_amt_early_fixed close_change_amt
,close_change_prcnt_early_fixed close_change_prcnt
from ##macd_start_end_early_fixed_results
union
-- rsi cycles with rsi ends results
select
 'rsi cycles with rsi ends' source
,symbol
,date_start
,date_end
,close_change_amt
,close_change_prcnt
from ##close_changes_with_rsi_ends
union
-- rsi cycles with macd ends results
select
 'rsi cycles with macd ends' source
,symbol
,date_start
,date_end
,close_change_amt
,close_change_prcnt
from ##close_changes_with_macd_ends
-- to exclude one faulty data record
where date_start < date_end
union
-- trend up trades results
select
 'trend up trades' source
,symbol
,date_start
,date_end
,close_change_amt
,close_change_prcnt
from ##mma_trend_up_with_close_vals
) for_all_trades
-- to exclude one faulty data record
where date_start < date_end
) for_source_by_cat
group by source
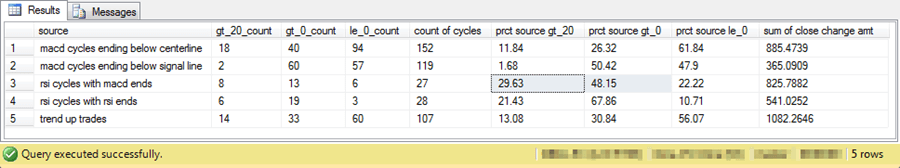
Here is a screen shot that displays the result set from the preceding query.
- The result set contains one row for each model, and the source column value specifies the model name for the remaining column values on a row.
- The next three columns report the count of buy/sell cycles that have a
- Percentage gain of more than twenty percent
- Percentage gain of less than or equal to twenty percent
- Percentage change of less than or equal to zero
- The count of cycles column displays the total count of cycles contributing results for a model.
- The entries in this column are the sum of the preceding three column values.
- The number of buy/sell cycles varies depending on the artificial intelligence model.
- The fewest number of buy/sell cycles are for the rsi cycles with macd ends model.
- The greatest number of buy/sell cycles are for the macd cycles ending below centerline model.
- The next three columns are the percentage of buy/sell cycles that have a gain of more than twenty percent, a gain of less than or equal to twenty percent, or no gain.
- The most favorable outcome possible is for the prcnt source gt_20 column value to equal one hundred percent; the least favorable outcome possible is for the prcnt source le_0 column value to be one hundred percent.
- By these criteria, the rsi cycles with macd ends model has the most favorable outcome relative to the other models. This is because the rsi cycles with macd ends model has the greatest percent of buy/sell cycles with gains of more than twenty percent.
- The rsi cycles with rsi ends model has the second highest prcnt source gt_20 column value. However, its cycles, with one exception for a data record that does not compute a valid sell date, all have the same start date as the rsi cycles with macd ends model.
- The model with the third highest prcnt source gt_20 column value is the trend up trades model. The trend up trades buy/sell cycles are substantially distinct from those for the rsi cycles with macd ends model.
- The last column in the screen shot below is the close change amount from the buy date through the sell date for a single share of stock across all buy/sell cycles for a model. Stock purchases are typically made for multiple stock shares, such as ten, one hundred, or more.
- The number in the column is a dollar amount of the close change amount across all ten stock symbols across nearly four years for all buy/sell cycles for a single share. You can multiply this number by ten, one hundred, or more for the expected gains from typical stock purchases.
- The three models with the largest dollar amount gain are in order
- trend up trades model
- macd cycles ending below centerline model
- rsi cycles with macd ends model
Another helpful perspective for comparing model results is to list the top and bottom ten buy/sell cycles across models. This can highlight which models are capturing the best and worst outcomes for different symbols. Also, it may provide insight about which two models to combine to get the most favorable outcomes (those with the top percentage gains).
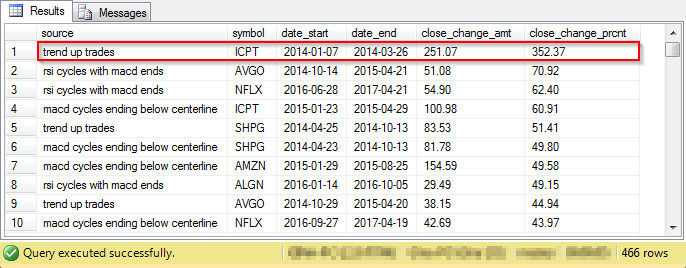
You can show the top and bottom ten by sorting the buy/sell cycles by their close change percent values. Before extracting in two separate queries the top or bottom ten buy/sell cycles, you can simply show ten rows in the result set sorted by close change percent. Then, you can alternately view the first ten rows and the last ten rows from the result set. The next two screen shots present these Result tab views; the first screen shot is for the top ten, and the second screen shot is for the bottom ten.
- The largest of the top ten buy/sell cycles was returned by the trend up trades model. The row depicting this trade is highlighted by a red border in the following screen shot. Note that this buy/sell cycle has a close_change_prcnt column value that is about five times as large as the second largest buy/sell cycle.
- The second largest buy/sell cycle is also substantially greater than many of the other top ten cycles. This buy/sell cycle is from the rsi cycles with macd ends model.
- It would be desirable to get results from both the trend up trades model and the rsi cycles with macd ends model in a single result set in order to get the top two buy/sell models
- The two buy/sell cycles with the most negative close_change_prcnt values are highlighted by a red border within the second screen shot below.
- Both buy/sell cycles are for the same symbol with the same start date.
- In addition, they are both for different variants of the rsi models – namely, the rsi cycles with rsi ends model and the rsi cycles with macd ends model.
- The rsi cycles with macd ends model detected both the second most positive percentage change and second most negative percentage change. This confirms that models generating exceptionally good results for some cycles can return exceptionally poor results for other cycles.

Building a combined model from two component models
The preceding section makes it clear that artificial intelligence models based on different technical indicators can generate buy/sell recommendations that provide positive returns overall. However, it is also clear that artificial intelligence models based on different indicators can detect different gaining and losing buy/sell cycles. This tendency for different gains from different models opens the question: can we combine two artificial intelligence models that generate more positive gains than either of the two input models?
I selected the rsi cycles with macd ends model and the trend up trades model to form a combined model. The process for combining model outcomes works as follows.
- First, select all buy/sell recommendations from the rsi cycles with macd ends model.
- Second, discover all buy/sell recommendations from the trend up trades model that do not have any overlap in dates with the rsi cycles with macd ends model.
- Third, add the non-overlapping buy/sell recommendations from the trend up trades model to the set of all buy/sell recommendations from the rsi cycles with macd ends model to form the buy/sell cycles for the combined model.
This section begins by reviewing T-SQL code that can create a combined set of recommendations across both source models. The section closes with an analysis that compares the results from the combined model with each of its sources.
The code starts by creating a temporary table named #temp that draws on a table from the AllNasdaqTickerPricesfrom2014into2017 database. The table has the name Results_with_extracted_casted_values, and it contains historical close price data for all symbols traded on the NASDAQ stock exchange, including the ten stock symbols tracked in this tip from as soon as the first trading date in 2014 through as recent as November 8, 2017.
The code for populating a fresh copy of the #temp table appears next. The table joins daily historical close price data from the Results_with_extracted_casted_values table with concatenated records from the union of tables with buy/sell recommendations from the rsi cycles with macd ends model and the trends up trades model. The concatenated result set includes data for all trading dates within the buy and sell dates for the recommendations for both source models. If a trading date is within the buy/sell dates for each model, then it appears in the concatenated result set twice. To track these duplicate records separately, a data_code column value is added to the concatenated result set for classifying each duplicate row in the concatenated result set as belonging to either of the two models. Detailed comments throughout the script describe the operation of key code segments.
use AllNasdaqTickerPricesfrom2014into2017
go
-- #temp joins daily historical price data
-- to source data from rsi cycles with macd ends
-- and trend up trade data
-- date_code is 1 for rsi cycles with macd ends
-- and 2 for trend up trade data

begin try
drop table #temp
end try
begin catch
print '#temp not available to drop'
end catch

select *
into #temp
from
(
-- get daily close prices for rsi cycles with macd ends
select *,1 date_code
from
(
-- overview of close changes with macd ends for rsi cycles
select
 'rsi cycles with macd ends' [source]
,symbol symbol_from_date_starts_ends
,date_start
,date_end
from ##close_changes_with_macd_ends
-- to exclude one faulty data record
where date_start < date_end
) rsi_cycles_with_macd_ends
left join
(
-- from_Results_with_extracted_casted_values
select
 symbol symbol_from_casted_values
,date
,[close]
from [dbo].[Results_with_extracted_casted_values]
where symbol in (select symbol from ##symbol)
) from_Results_with_extracted_casted_values
on from_Results_with_extracted_casted_values.symbol_from_casted_values
= rsi_cycles_with_macd_ends.symbol_from_date_starts_ends
and from_Results_with_extracted_casted_values.date
>= rsi_cycles_with_macd_ends.date_start
and from_Results_with_extracted_casted_values.date
<=  rsi_cycles_with_macd_ends.date_end
) rsi_for_join_with_trend_up
union
select *
from
(
-- get daily close prices for trend up cycles
select *,2 date_code
from
(
select
 'trend up trades' [source]
,symbol symbol_from_date_starts_ends
,date_start date_start
,date_end date_end
from ##mma_trend_up_with_close_vals
) trend_up_trades
left join
(
-- from_Results_with_extracted_casted_values
select
 symbol symbol_from_casted_values
,date
,[close]
from [dbo].[Results_with_extracted_casted_values]
) from_Results_with_extracted_casted_values
on from_Results_with_extracted_casted_values.symbol_from_casted_values
= trend_up_trades.symbol_from_date_starts_ends
and from_Results_with_extracted_casted_values.date
>= trend_up_trades.date_start
and from_Results_with_extracted_casted_values.date
<=  trend_up_trades.date_end
) for_daily_closes_for_rsi_macd_and_trendup
order by symbol_from_date_starts_ends, date
-- display contents of the #temp table
-- select * from #temp order by symbol_from_date_starts_ends, date
One way of quickly grasping what the preceding code does is to examine selected rows from the result set for the commented select statement at the end of the script. This commented select statement displays the rows of the #temp table sorted by symbol (symbol_from_date_starts_ends) and trading date (date).
The first of three excerpts from the result set appears next. Rows 20 through 25 are for the ALGN buy/sell cycle that starts on 2014-09-09 and extends 2014-09-16 as well as the beginning of another ALGN cycle that starts on 2014-10-20 and extends through 2015-02-02. The rows for first cycle have a yellow background, and the rows for the second cycle have a pink background.
- The rows for the first cycle are all from a trend up trades buy/sell cycle.
- The first four columns are from the ##mma_trend_up_with_close_vals table; recall that this table holds the start and end dates for trend up trades buy/sell cycles.
- The next three columns are from the Results_with_extracted_casted_values table. These columns add the symbol, close date, and close price to the result set. Recall that these data values are at the level of daily trade dates. Therefore, these three columns are more granular than the source data for the first four columns.
- The last column (date_code) is computed in the query creating the result set. This column denotes a row as showing data from either a trend up trades buy/sell cycle with a value of 2 or a rsi cycles with macd ends buy/sell cycle with a value of 1.
- The first block of six rows does not include dates for 2014-09-13 and 2014-09-14. Both of these dates are weekend days during which there is no stock trading.
- The first four rows for the next buy/sell cycle appear in rows 26 through 29. These four rows all are from the rsi cycles with macd ends model.
- All six rows for the trend up trades model are non-overlapping rows because there is no mix of rows from two different types of business cycles.

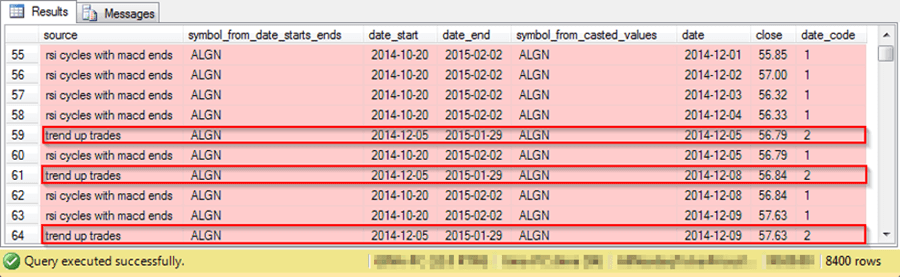
The next screen shot shows another selection of rows from the second buy/sell cycle beginning in the bottom of the preceding screen shot.
- The rows in the following screen shot are of special interest because they include the first three overlapping rows from the trend up trades model. The trend up trades buy/sell cycle rows appear with red borders.
- Notice that the date_code value for the three trend up trades buy/sell cycle rows all have a date_code value of 2.
- The start date for the trend up trades rows is 2014-12-05. This date value is also the date column value for the date column within the first trend up trades row.
- The start and end dates for the rsi cycles with macd ends rows are the same as in the preceding screen shot – respectively, 2014-10-20 and 2015-02-02.
The next screen shot shows the last ten rows of the buy/sell cycle depicted in the preceding two screen shots.
- Again, rows from the trend up trades model appear with a red border.
- The last of the trend up trades buy/sell cycle rows appears in row 132. Notice that the date column value (2015-01-29) for this row matches the date_end column value.
- Also, notice that there are two trailing rsi cycles with macd ends rows after the last trend up trades buy/sell cycle row.
- As you can see, the trend up trades cycle rows are nested within the rsi cycles with macd ends rows because the first trend up trades cycle row appears after the first rsi cycles with macd ends row and the last trend up trades cycle row appears before the last rsi cycles with macd ends row. These nested trend up trades rows denote overlapping rows.

The next code block processes the #temp table in coordination with a couple of other tables to generate the ##mma_trend_up_with_close_vals_non_overlap table. The ##mma_trend_up_with_close_vals_non_overlap table has a row for each trend up trades buy/sell cycle that has no overlap with any rsi cycles macd ends buy/sell cycles. The table has the same layout as the ##mma_trend_up_with_close_vals table containing all the rsi cycles with macd ends buy/sell cycles. The last processing step concatenates rows from the ##mma_trend_up_with_close_vals_non_overlap table with the rows of the ##close_changes_with_macd_ends global temporary table to form a new result set with all rsi cycles with macd ends and non-overlap trend up trades buy/sell cycles. These rows specify the buy/sell cycles for the new combined artificial intelligence model.
- One of the other special intermediate tables has the name ##mma_trend_up_symbol_date_starts_ends_overlap. This table contains a row_ind identifier value for symbol, start date, and end date for all trend up trades buy/sell cycles. The base source for this table is the ##mma_trend_up_with_close_vals table supplemented by a computed row_ind field based on the T-SQL row_number function.
- Another special processing table is the ##mma_trend_up_symbol_date_starts_ends_with_overlap_count table. This table contains a field with the count of overlapping rows in each trend up cycle with one or more rsi cycles macd end trading dates.
- If there is no overlap, then the rsi_cnt field has a value of zero.
- Otherwise, the rsi_cnt field has a value of greater than zero.
- The ##mma_trend_up_with_close_vals table rows corresponding to zero overlap rows are saved in the ##mma_trend_up_with_close_vals_non_overlap table.
-- Counts overlap between trend up trades buy/sell cycles
-- and rsi cycles with macd ends buy/sell cycles
-- when count is zero for a trend up trades buy/sell cycle
-- it is saved in the ##mma_trend_up_with_close_vals_non_overlap table
-- rsi_cnt field in the ##mma_trend_up_symbol_date_starts_ends_with_overlap_count
-- table saves overlap counts
-- declare local variables for while use setup
-- and for use inside while loop
declare @date_start date, @date_end date, @symbol_from_date_starts_ends varchar(5),
@row_ind int, @row_ind_cnt int

--  trend up cycle row_ind, symbol, date_start, and date_end values
begin try
drop table ##mma_trend_up_symbol_date_starts_ends_overlap
end try
begin catch
print '##mma_trend_up_symbol_date_starts_ends_overlap not available to drop'
end catch
--  trend up cycle row_ind, symbol, date_start, and date_end values
begin try
drop table ##mma_trend_up_symbol_date_starts_ends_with_overlap_count
end try
begin catch
print '##mma_trend_up_symbol_date_starts_ends_with_overlap_count not available to drop'
end catch
create table ##mma_trend_up_symbol_date_starts_ends_with_overlap_count
(
 symbol_from_date_starts_ends varchar(5)
,date_start date
,date_end date
,rsi_cnt int
)
-- select * from ##mma_trend_up_symbol_date_starts_ends_with_overlap_count

-- ##mma_trend_up_symbol_date_starts_ends_overlap is to facilitate
-- identification of overlap between trend up trades in
-- ##mma_trend_up_with_close_vals and rsi cycles with macd ends
select
 'trend up trades' [source]
,row_number() over (order by symbol, date_start) row_ind
,symbol
,date_start
,date_end
into ##mma_trend_up_symbol_date_starts_ends_overlap
from ##mma_trend_up_with_close_vals
order by symbol, date_start
-- display ##mma_trend_up_symbol_date_starts_ends_overlap rows
-- select * from ##mma_trend_up_symbol_date_starts_ends_overlap
-- assign values to local variables to facilitate looping through
-- rows of ##mma_trend_up_symbol_date_starts_ends_overlap
set @row_ind = 1
set @row_ind_cnt = (select  count(*) from ##mma_trend_up_symbol_date_starts_ends_overlap)

while @row_ind <= @row_ind_cnt
begin
-- set local variables for symbol, start date, and end date
-- to extract data from successive rows in the
-- the ##mma_trend_up_symbol_date_starts_ends_overlap table within
-- the while loop
set @symbol_from_date_starts_ends =
(select symbol from ##mma_trend_up_symbol_date_starts_ends_overlap
where row_ind = @row_ind)
set @date_start =
(select date_start from ##mma_trend_up_symbol_date_starts_ends_overlap
where row_ind = @row_ind)
set @date_end =
(select date_end from ##mma_trend_up_symbol_date_starts_ends_overlap
where row_ind = @row_ind)

-- counts of rsi cycles with macd ends matching
-- trend up cycles are computed and saved in the rsi_cnt
-- field of the ##mma_trend_up_symbol_date_starts_ends_with_overlap_count table

-- count of zero means trend up cycle did not
-- overlap with rsi cycles with macd back ends
insert ##mma_trend_up_symbol_date_starts_ends_with_overlap_count
select
@symbol_from_date_starts_ends symbol_from_date_starts_ends
,@date_start date_start
,@date_end date_end
,sum(rsi_in_trend_up) rsi_cnt
from
(
select
*,
case
when date_code = 1 then 1
else 0
end rsi_in_trend_up
from #temp
where
symbol_from_date_starts_ends = @symbol_from_date_starts_ends
and date >= @date_start
and date <= @date_end
) for_rsi_in_trend_up_cnt
group by symbol_from_date_starts_ends
-- increment @row_ind to access next row in the
-- ##mma_trend_up_symbol_date_starts_ends_overlap table
set @row_ind = @row_ind + 1
end

-- for non-overlap trend up trades
-- where rsi_cnt = 0 returns non-overlap trades
-- where rsi_cnt > 0 returns overlap trades
begin try
drop table ##mma_trend_up_with_close_vals_non_overlap
end try
begin catch
print '##mma_trend_up_with_close_vals_non_overlap not available to drop'
end catch
select
 'trend up trades non-overlap' [source]
,original_##mma_trend_up_with_close_vals.symbol
,original_##mma_trend_up_with_close_vals.date_start
,original_##mma_trend_up_with_close_vals.date_end
,original_##mma_trend_up_with_close_vals.close_change_amt
,original_##mma_trend_up_with_close_vals.close_change_prcnt
into ##mma_trend_up_with_close_vals_non_overlap
from
(
-- overview of close changes for trend up trades
select
 'trend up trades' [source]
,symbol
,date_start
,date_end
,close_start_date
,close_end_date
,close_change_amt
,close_change_prcnt
from ##mma_trend_up_with_close_vals
--order by symbol, date_start
) original_##mma_trend_up_with_close_vals
left join
(
select
 symbol_from_date_starts_ends symbol_from_overlap_count
,date_start date_start_from_overlap_count
,date_end date_end_from_overlap_count
,rsi_cnt
from ##mma_trend_up_symbol_date_starts_ends_with_overlap_count
) from_overlap_counts_table
on
original_##mma_trend_up_with_close_vals.symbol
= from_overlap_counts_table.symbol_from_overlap_count
and original_##mma_trend_up_with_close_vals.date_start
= from_overlap_counts_table.date_start_from_overlap_count
and original_##mma_trend_up_with_close_vals.date_end
= from_overlap_counts_table.date_end_from_overlap_count
where rsi_cnt = 0

order by symbol, date_start
-- displays non_overlap trends up trades buy/sell cycles
-- select * from ##mma_trend_up_with_close_vals_non_overlap
The next code block creates a new summary report comparing the combined model buy/sell cycles with both the original trend up trades cycles and the rsi cycles with macd end cycles. Within the innermost query a union operator concatenates the rsi cycles with macd end rows to the non-overlap trend up rows. This concatenated result set is the source buy/sell cycle data for the new combined model.
-- cross tab for source by close_change_prcnt category
-- for rsi with macd end and trend up trades
select
source
,sum(gt_20) gt_20_count
,sum(gt_0) gt_0_count
,sum(le_0) le_0_count
,
sum(gt_20)
+sum(gt_0)
+sum(le_0)
[count of cycles]
,
round(
cast(sum(gt_20) as float)
/
cast
(
 (
 sum(gt_20)
 +
 sum(gt_0)
 +
 sum(le_0)
 )
 as float
) * 100
,2) [prct source gt_20]
,
round(
cast(sum(gt_0) as float)
/
cast
(
 (
 sum(gt_20)
 +
 sum(gt_0)
 +
 sum(le_0)
 )
 as float
) * 100
,2) [prct source gt_0]
,
round(
cast(sum(le_0) as float)
/
cast
(
 (
 sum(gt_20)
 +
 sum(gt_0)
 +
 sum(le_0)
 )
 as float
) * 100
,2) [prct source le_0]
,sum(close_change_amt) [sum of close change amt]
from
(
-- zero-one close_change_prcnt_cats
select
*
,
case
when close_change_prcnt > 20 then 1
else 0
end gt_20
,
case
when close_change_prcnt > 0 and close_change_prcnt <= 20 then 1
else 0
end gt_0
,
case
when close_change_prcnt <= 0 then 1
else 0
end le_0
from
(
-- overview of close changes with macd ends for trades
select
 'rsi cycles with macd ends' source
,symbol
,date_start
,date_end
,close_change_amt
,close_change_prcnt
from ##close_changes_with_macd_ends
-- to exclude one faulty data record
where date_start < date_end
union
-- overview of close changes for trend up trades
select
 'trend up trades' source
,symbol
,date_start
,date_end
,close_change_amt
,close_change_prcnt
from ##mma_trend_up_with_close_vals
union
(
-- overview of close changes for rsi with macd end
-- and non_overlap trend up for trades
select
 'rsi macd end and non_overlap trend up' source
,symbol
,date_start
,date_end
,close_change_amt
,close_change_prcnt
from ##close_changes_with_macd_ends
-- to exclude one faulty data record
where date_start < date_end
union
select
 'rsi macd end and non_overlap trend up' source
,symbol
,date_start
,date_end
,close_change_amt
,close_change_prcnt
from ##mma_trend_up_with_close_vals_non_overlap
)

) for_all_trades
) for_source_by_cat
group by source
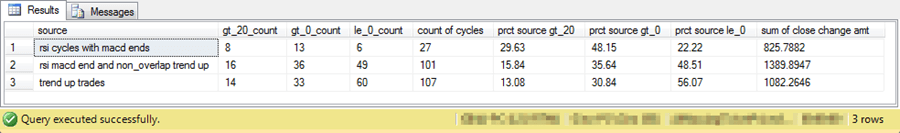
Here’s the report generated by the preceding script.
- The second row with a source column value of rsi macd end and non_overlap trend up reports results for the new combined model.
- The two other report rows are two sources from the original five artificial intelligence models. These two sources contribute selected source data rows to the new combined model.
- The most prominent feature to highlight is that the new combined model has a sum of close change amount column value that is more than twenty-five percent higher than any of the original five artificial intelligence models.
- Also, slightly more than fifty percent of the buy/sell cycles for the new combined model have a positive close change amount. This outcome is above the average of the two source component models.
Modeling Lessons Learned
The lessons learned in this tip are for approaches to comparing artificial intelligence models, demonstrating which of the original five models performed best, and assessing if the combined model generates superior performance to its base input models.
Here are some lessons learned for comparing models.
- The value in the sum of the close_change_amt column for the comparison tables represents the sum of the change amounts for a single stock share bought and sold over all the buy/sell cycles for a model. This column value may be the single most definitive estimate of the performance of a model because it represents the total gain or loss for a single stock share across all buy/sell cycles for a model.
- Several other metrics in the comparison tables can help you understand how the models operate.
- The percentage of buy/sell cycles with gains of over twenty percent has a bigger impact on model assessment than the percentage of buy/sell cycles with gains of twenty percent or less.
- Therefore, it is informative to track separately the number of relatively large gains versus the number of less large gains by model.
- Additionally, a simple listing of the individual buy/sell cycle gains and losses provide further insight about model operation. For the sample of stocks and models used in this tip here are some findings.
- A few gains for buy/sell cycles from selected models can be substantially greater than any other gains.
- To a somewhat lesser degree, losses for buy/sell cycles from selected models can be substantially greater than any other losses.
- Additional research may be merited to assess if these exceptionally large gains and losses occur randomly or if they are tied to a specific set of factors. For example, do the extraordinary gains and/or losses occur systematically for particular artificial intelligence models.
Here are some lessons learned from comparing the original five models.
- All five original artificial intelligence models for calculating buy and sell dates have positive gains for the ten stocks over the nearly four-year span of historical price data used in this tip.
- The model with the most positive gain is the trends up trades model.
- This model generated larger gains than any other model.
- One contributing factor to this model’s performance is that it recognized a buy/sell cycle that was nearly five times larger than the next largest gain of any other buy/sell cycle. In turn, the buy/sell cycle with the second largest gain was substantially larger than the gains for many other buy/sell cycles.
- The number of buy/sell cycles varies considerably between models — from as few as 27 for the rsi cycles with macd ends model to as many as 152 for the macd cycles ending below centerline model.
- The two models based on the RSI indicator have substantially fewer trades than any of the other models.
- The RSI-based models achieve their overall gains with dramatically fewer buy/sell cycles. Because the gains for the two RSI models is roughly comparable to the other models, the RSI-based models generate substantially greater gains per buy/sell cycle.
Here are some lessons learned from comparing a combined model to its two source models.
- In performing the comparison of a combined model to its source models, it is important to remove buy/sell cycles from one model that overlap in dates with buy/sell cycles from the other source model. Failing to do so would result in overweighting close change amounts from buy/sell cycles with overlapping dates.
- The combined model based on the rsi cycles with macd ends model and the trend up trades model generate dramatically superior performance than either of its two component models.
Next Steps
There are three sets of steps necessary for trying out the scripts from this tip.
First, you need to download the backup file for the AllNasdaqTickerPricesfrom2014into2017 database Second, you need to download script files that can create the macd_indicators table, the rsi table , and the ewma_10_30_50_200 table in the AllNasdaqTickerPricesfrom2014into2017 database. The third step is to download the files for this tip. Finally, I close by indicating that this tip is not recommending any particular stocks, including those for which results are reported in this tip nor is it recommending any specific trading rules. The stocks reported on in this tip were selected based on multiple objective business rules. At the time that I submitted this tip to MSSQLTips.com, I and my family members held positions in a subset of these stocks. I do occasionally use selected technical indicators, including the MACD, RSI, and multiple moving average indicators, in making decisions about which stocks to buy and when to sell stocks, but I do not routinely use the precise trading rules covered in this tip. Rick Dobson is a SQL Server professional with decades of T-SQL experience that includes authoring books, running a national seminar practice, working for businesses on finance and healthcare development projects, and serving as a regular contributor to MSSQLTips.com. He has been a practicing Python developer for more than the past half decade – with a special emphasis for data visualization and ETL tasks with JSON and CSV files. His most recent professional passions include financial time series data and analyses, AI models, and statistics. If you are interested in growing your skills in any of these areas especially as they relate to financial securities, consider visiting his blog at https://securitytradinganalytics.blogspot.com/2023/12/.